Modern businesses rely heavily on dashboards to monitor performance, track KPIs, and make data-driven decisions. But as data grows, many dashboards become slow, cluttered, and difficult to use. This is where Looker Studio optimization becomes essential.
Without proper optimization, even the most visually appealing reports can suffer from poor performance and unreliable insights. That’s why many companies invest in Looker Studio consulting services to improve dashboard speed, structure, and usability.
At its core, Looker Studio optimization focuses on improving how data is connected, processed, and visualized so that dashboards remain fast, scalable, and user-friendly.
Organizations working with professional data analytics services often realize that the real power of dashboards lies not just in visuals — but in how efficiently they are built and optimized.
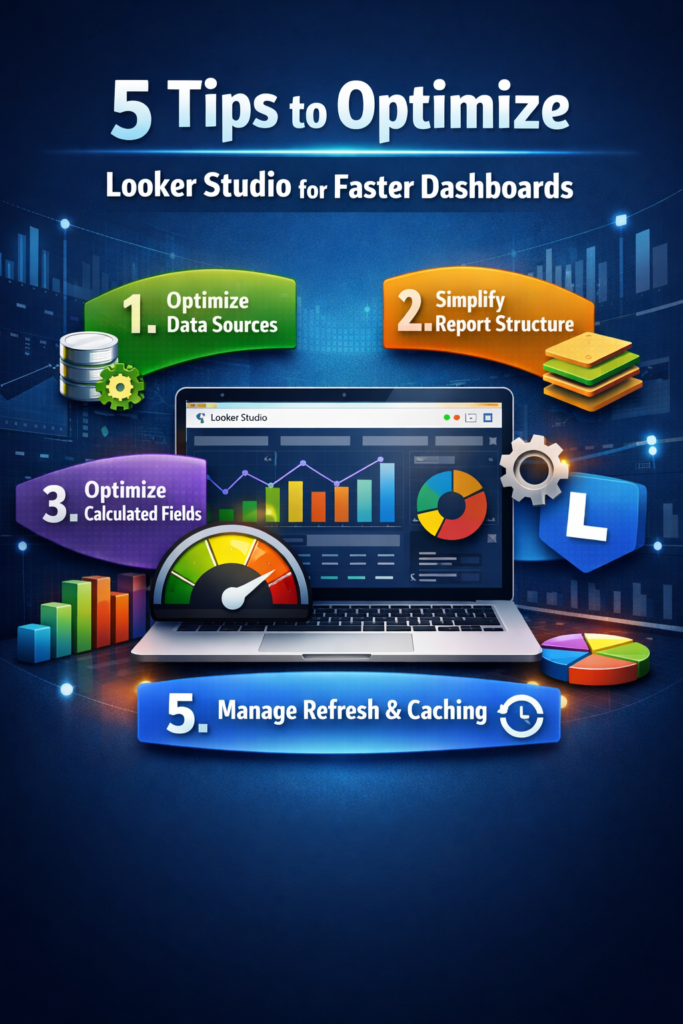
In this article, we’ll explore five practical tips to optimize Looker Studio dashboards, improve performance, and deliver better analytics experiences.
Why Optimization Matters in Looker Studio
Before focusing on design and visuals, it’s important to ensure that dashboards are technically optimized.
Without proper optimization, businesses face issues such as:
- inconsistent metrics
- slow dashboard performance
- cluttered report structur
- inaccurate or delayed insights
Strong optimization solves these problems by improving dashboard speed, structure, and reliability.
Organizations using professional analytics and reporting consulting services often optimize dashboards before scaling them across teams.
This foundation allows teams to build reliable BI dashboard solutions, interactive analytics reports, and scalable business dashboards for leadership teams.
Core Tips to Optimize Looker Studio Dashboards
Let’s explore some essential techniques used in modern business intelligence consulting services and analytics projects.
1. Optimize Data Sources
The foundation of every Looker Studio dashboard is its data source.
Using multiple connectors, raw datasets, or heavy queries can significantly slow down performance.
Best practices include reducing unnecessary fields, filtering data at the source level, avoiding excessive data blending, and using extracted data where possible.
For example:
A sales dashboard connected to a clean and filtered dataset becomes faster and more reliable because Looker Studio processes less unnecessary data.
2. Simplify Report Structure
Overloading dashboards with too many charts and elements is one of the most common mistakes.
A cluttered report not only slows performance but also makes insights harder to understand.
Optimization techniques include limiting the number of charts per page, removing unused components, organizing content into multiple pages, and using clear navigation.
For instance:
An executive dashboard should focus only on key KPIs instead of displaying every available metric.
3. Optimize Calculated Fields
Calculated fields are powerful but can impact performance when overused or poorly structured.
Complex or repeated calculations can slow down dashboards significantly.
Best practices include minimizing redundant calculations, using pre-calculated fields in the data source, simplifying formulas, and avoiding heavy calculations on blended data.
Example:
Instead of calculating profit margins in multiple charts, define it once in the data source and reuse it across the dashboard.
4. Use Efficient Visualizations
Not all visualizations are equal in terms of performance.
Heavy charts, large tables, and excessive interactivity can slow down rendering.
Optimization strategies include using fewer high-impact visuals, avoiding overly detailed tables, limiting interactive elements, and focusing on clarity over complexity.
For example:
A simple bar chart showing top-performing products is often more effective than a dense table with hundreds of rows.
5. Manage Data Refresh and Caching
Frequent data refresh and real-time connections can put unnecessary load on dashboards.
In many cases, real-time data is not required.
Best practices include scheduling data refresh intervals, using caching effectively, avoiding unnecessary real-time connections, and optimizing refresh frequency based on use case.
For instance:
A marketing dashboard updated daily is often sufficient instead of refreshing every few minutes.
How Looker Studio Optimization Improves Analytics
Companies investing in Looker Studio optimization often experience significant improvements in reporting performance and usability.
Here’s how structured optimization enhances analytics workflows:
- Faster dashboard performance with reduced load time
- Better user experience through clean and structured layouts
- More efficient calculations with consistent KPI tracking
- Scalable reporting systems across teams and departments
- Improved decision-making with faster access to insights
Real Example: Marketing Performance Dashboard
Consider a company tracking its marketing performance across multiple channels.
Without proper optimization, the company may rely on disconnected data sources and slow dashboards.
With optimized Looker Studio dashboard development, the company can structure its system more efficiently.
Using this approach, analysts can create dashboards that show:
- campaign ROI
- lead generation performance
- channel-wise conversions
Executives can then review insights through dashboards that display critical business metrics in a fast and reliable way.
Transitioning from Basic to Optimized Dashboards
Many organizations begin their analytics journey with basic dashboards.
As data grows, performance issues become more visible.
During optimization, teams refine data sources, reduce manual calculations, improve dashboard structure, and remove unnecessary elements.
This transition allows companies to move toward faster, scalable, and more reliable analytics systems.
The Role of Visual Dashboards
Once dashboards are optimized, visualization becomes more impactful.
Well-designed dashboards allow decision-makers to understand complex data quickly.
For example:
A leadership team reviewing a performance dashboard can instantly identify trends, gaps, and growth opportunities.
Similarly, marketing teams can evaluate campaign success using clear and interactive visual reports.
Why Businesses Choose VisualizExpert for Looker Studio Solutions
Building effective dashboards requires both technical expertise and strategic understanding.
At VisualizExpert, our team specializes in delivering scalable analytics solutions that help organizations optimize dashboards and improve reporting performance.
Our services include Looker Studio optimization services, interactive dashboard development, data analytics consulting, performance-focused BI solutions, and scalable reporting systems.
By combining technical optimization with business insights, VisualizExpert helps companies build dashboards that support smarter decision-making.
Final Thoughts
Dashboard performance plays a critical role in business success.
Optimizing Looker Studio dashboards ensures that reports remain fast, clear, and scalable as data grows.
Techniques like optimizing data sources, simplifying structure, improving calculations, refining visualizations, and managing refresh settings help transform dashboards into high-performance analytics tools.
When implemented correctly, these strategies power everything from operational reports to executive dashboards.
If your organization is planning to improve dashboard performance or scale analytics systems, professional Looker Studio optimization services can make a significant difference.
At VisualizExpert, we help businesses design high-performance dashboards and build analytics systems that support data-driven decision-making.
To explore how optimized dashboards can transform your reporting environment, visit visualizexpert.com.
Leave a Reply