You can generate a dashboard in minutes today.
Just describe what you want, and AI tools will build charts, metrics, and layouts instantly. It feels like a breakthrough for teams chasing speed.
But here’s the uncomfortable reality: Power BI Data Modeling Services matter more than ever in this new “instant dashboard” era.
Because speed without structure doesn’t create clarity — it creates confusion at scale.
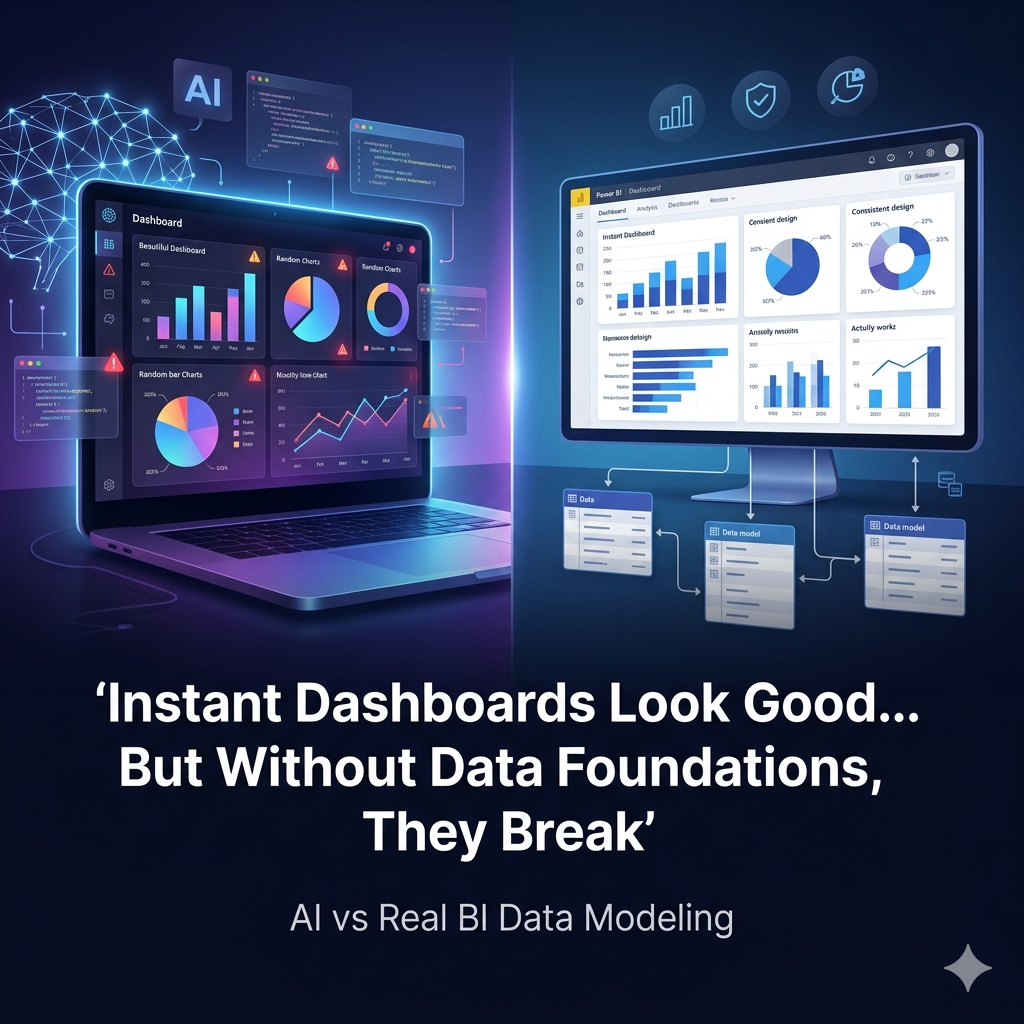
The Illusion of Instant Insights
Vibe coding promises a simple workflow: describe, generate, visualize.
And yes, it delivers fast results.
You’ll get:
- Clean charts
- Functional queries
- Visually impressive dashboards
But what you won’t get is alignment.
Most businesses already struggle with fragmented systems. CRM data doesn’t match ERP data. Marketing numbers don’t align with finance. Definitions vary across teams.
AI doesn’t fix this. It simply builds on top of it.
That’s why companies investing heavily in data analytics services still face the same issue:
Dashboards look right — but decisions feel wrong.
Where Instant Dashboards Break Down
The problem isn’t the tool or the code.
It’s the assumptions.
AI-generated dashboards assume:
- Your data is clean
- Your metrics are defined
- Your relationships are correct
In reality, none of these are guaranteed.
Without a proper Unified Reporting Data Model, you end up with:
- Conflicting KPIs
- Duplicate calculations
- Misleading trends
This is where many organizations hit a wall, even after investing in Power BI dashboard development or BI dashboard solutions.
They built dashboards quickly.
But they didn’t build them correctly.
The Missing Layer: Data Modeling
This is where Power BI changes the game — not because it’s more powerful than AI, but because it forces discipline.
A strong Power BI data modeling approach defines:
- What each metric means
- How tables connect
- Which numbers are trusted
With proper Power BI star schema design, your data becomes structured, scalable, and consistent.
This isn’t flashy work. It’s foundational.
But it’s also the reason why some companies trust their dashboards — and others don’t.
Power BI Data Modeling Services for Reliable Insights
If you want dashboards that actually drive decisions, you need more than visuals.
You need Power BI Data Modeling Services for Reliable Business Intelligence.
This approach focuses on:
- Creating scalable data models
- Standardizing KPIs across teams
- Optimizing performance with DAX formula optimization
- Ensuring consistency across interactive business dashboards
Instead of building isolated reports, you build a system.
And that system supports:
- Executive analytics dashboards
- Power BI reporting solutions
- Custom Power BI reports
Now, every dashboard pulls from the same truth.
Why AI Alone Isn’t Enough
AI is excellent at execution.
It can:
- Generate queries
- Suggest visuals
- Speed up development
But it cannot define your business logic.
It won’t know:
- Which revenue metric finance trusts
- How customer data should be unified
- Why one KPI matters more than another
That’s why even with Power BI automation, you still need strategic input.
Without it, you’re just automating confusion.
The Right Way to Combine AI and BI
The smartest teams aren’t choosing between AI and Power BI.
They’re combining both — in the right order.
- Build your foundation using Power BI consulting services
- Define metrics with a Business-Aligned Metrics Framework
- Structure data using scalable data models
- Then use AI to accelerate dashboard creation
This approach transforms AI from a shortcut into a multiplier.
Now you’re not just building dashboards faster.
You’re building the best Power BI dashboards — faster.
From Data Chaos to Decision Clarity
When you invest in proper foundations, everything changes.
Your dashboards become:
- Consistent across teams
- Faster to load and update
- Easier to trust
With strong data integration services and cloud data warehouse integration, your data flows seamlessly.
Add real-time data dashboards powered by real-time data syncing APIs, and decisions happen instantly — not after reports are generated.
This is where decision-ready data visualization becomes real.
The Business Impact of Strong Data Foundations
Without structure:
- Teams debate numbers
- Reports get ignored
- Decisions get delayed
With proper modeling and strategy:
- Teams align on metrics
- Dashboards drive action
- Decisions happen faster
This is the difference between:
- Reporting systems
- Decision systems
And that difference directly impacts growth.
Beyond Dashboards: Building a BI Ecosystem
Modern BI isn’t just about Power BI.
It includes:
- Tableau dashboard design for exploratory analysis
- Looker Studio marketing reports for campaign tracking
- Google Analytics 4 visualizations for digital insights
But regardless of the tool, the foundation remains the same:
- Clean data
- Clear definitions
- Strong modeling
Without that, every platform fails in the same way.
The Role of Strategy in BI Success
Technology doesn’t solve BI problems.
Strategy does.
With analytics strategy services and KPI strategy consulting, businesses can:
- Identify high-impact decisions
- Prioritize the right metrics
- Build dashboards that matter
This is how you move from:
- Data overload
- To actionable insights
And ultimately toward data-driven decision making.
Why Most Companies Get This Wrong
Most teams prioritize speed over structure.
They:
- Launch dashboards quickly
- Add more metrics over time
- Try to fix issues later
But BI doesn’t work backward.
Without a foundation, complexity grows.
That’s why many organizations end up rebuilding everything — after wasting time and budget.
A Smarter Approach to BI
Start small.
Focus on one decision.
Build a clean model around it.
Then expand.
With Power BI integration services, API integration services, and automated data pipeline engineering, you can scale without breaking your system.
Add data quality anomaly detection, and you ensure accuracy as you grow.
This is how modern BI systems evolve:
- Fast
- Flexible
- Reliable
Final Thoughts: Fast Isn’t Enough
Vibe coding made dashboards faster.
But it didn’t make them better.
The real advantage comes from combining:
- Speed (AI)
- Structure (data modeling)
- Strategy (BI roadmap)
Because in the end:
A fast dashboard that’s wrong is worse than no dashboard at all.
If your dashboards look impressive but don’t drive decisions, the issue isn’t your tool.
It’s your foundation.
Ready to Build Dashboards That Actually Work?
At Visualizexpert.com, the focus is simple:
- Build strong data foundations
- Create scalable BI systems
- Deliver dashboards people trust and use
From enterprise data visualization to interactive dashboard design, the goal is to turn your data into a real decision engine.
Because success doesn’t come from generating dashboards faster.
It comes from making better decisions — faster.
Leave a Reply