Data analytics services are no longer just about creating dashboards. As modern BI platforms like Tableau Cloud scale across departments, geographies, and thousands of users, the real challenge shifts to governance, observability, and trust.
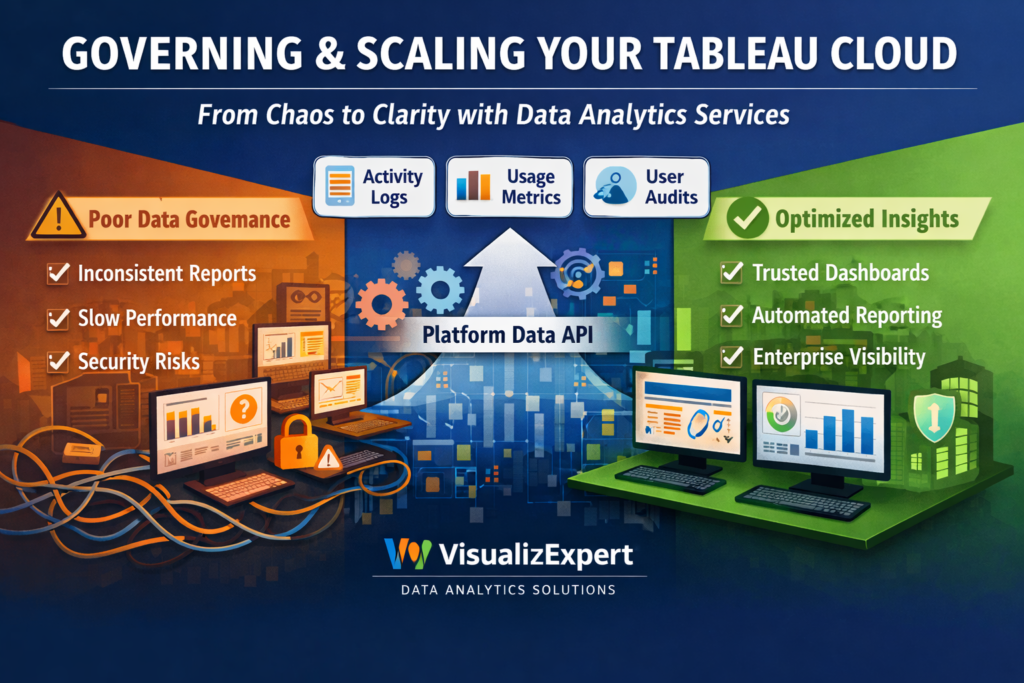
In the first 100 days of growth, teams celebrate adoption. In the next 12 months, they struggle with performance issues, duplicated dashboards, inconsistent KPIs, and growing security concerns. This is exactly the gap Tableau’s Platform Data API addresses — and where VisualizExpert helps organizations turn raw platform data into actionable intelligence.
Why BI Breaks at Scale (and Why Observability Matters)
Most organizations underestimate how quickly BI environments become complex. As more users publish content, schedule extract refreshes, and query shared data sources, even well-designed dashboards can turn into operational blind spots.
This is why business intelligence consulting today must go beyond visuals. Enterprises need visibility into how analytics platforms are being used — not just what they show.
Business intelligence consulting
At VisualizExpert, we work with BI leaders to design governance-first analytics strategies, combining platform telemetry with executive reporting so decisions are based on reality, not assumptions.
From Self-Service to System-Level Intelligence
Tableau’s Platform Data API introduces a critical shift: admins can now pull event-level data across sites, users, permissions, refreshes, and performance logs. But raw observability data alone isn’t enough.
This is where custom analytics solutions become essential.
Custom analytics solutions
VisualizExpert transforms Tableau Cloud event data into curated insights — highlighting unused dashboards, slow-performing extracts, risky permission changes, and adoption patterns that impact ROI.
KPI Design for Platform Health, Not Just Business Metrics
Most BI teams track revenue, pipeline, or marketing KPIs — but ignore the KPIs that keep analytics healthy. Without them, growth creates friction.
KPI dashboard services
We design KPI frameworks that monitor BI usage, content quality, refresh reliability, and user engagement — so leaders know whether their analytics ecosystem is strengthening or silently degrading.
Designing Scalable Models Behind Observability Dashboards
Platform data APIs generate high-volume, event-driven data. Without proper modeling, dashboards slow down and lose credibility.
Power BI Star Schema Design
When organizations consolidate Tableau observability data into Power BI or cloud warehouses, VisualizExpert applies star schema modeling to ensure fast queries, consistent metrics, and future-proof analytics.
Embedded Observability for Admins and Leaders
Admins shouldn’t need to export logs manually or switch tools to understand platform health.
Power BI Embedded Analytics
We embed observability dashboards directly into internal admin portals, making performance monitoring, audit readiness, and usage analysis accessible to the right stakeholders in real time.
Visual Clarity Is Not Optional at Enterprise Scale
When hundreds of users rely on dashboards daily, poor design creates misinterpretation — not insight.
Data visualization services
VisualizExpert applies enterprise visualization standards so observability dashboards surface risks, trends, and anomalies clearly — without overwhelming administrators or executives.
Managing BI Platforms Is an Ongoing Responsibility
Governance isn’t a one-time project. As Tableau environments evolve, so must monitoring and optimization.
Power BI Managed Services
Our managed services ensure observability dashboards stay accurate, data models remain optimized, and reporting adapts as Tableau Cloud features expand.
Turning Platform Data into Leadership-Ready Views
Executives don’t want logs — they want answers.
BI dashboard solutions
We translate technical platform data into leadership-friendly dashboards that explain adoption ROI, cost efficiency, risk exposure, and analytics maturity.
Interactive Monitoring for Faster Decisions
Static admin reports don’t scale.
Interactive business dashboards
VisualizExpert builds interactive dashboards that allow admins to drill from global platform health into site-level or user-level events within seconds.
Enterprise Governance Requires Enterprise-Grade Design
Large organizations need more than functional dashboards — they need confidence.
Enterprise data visualization
We apply enterprise visualization principles that support auditability, compliance, and clarity across complex Tableau Cloud deployments.
Executive Views That Align BI With Strategy
Analytics leaders must justify investments and adoption.
Executive analytics dashboards
Our executive dashboards connect platform usage data to business outcomes — helping leaders understand how analytics supports growth, not just reporting.
Modeling Matters More Than Tools
Without strong modeling, even the best APIs fail.
Power BI Data Modeling Services
We design scalable data models that integrate Tableau Platform Data API outputs with cloud warehouses, identity systems, and cost data.
Moving Teams Off Spreadsheet-Based Monitoring
Manual tracking doesn’t survive scale.
Power BI Migration from Excel
VisualizExpert helps BI teams migrate ad-hoc Excel-based admin tracking into automated, governed dashboards with historical context.
Tableau Expertise Still Matters
Observability doesn’t replace design — it enhances it.
Tableau Dashboard Design
We redesign Tableau dashboards using usage insights from the Platform Data API — removing unused content and optimizing high-impact views.
Consulting That Connects Tools, Data, and Decisions
Technology alone doesn’t fix governance gaps.
Power BI consulting services
Our consultants align Tableau, Power BI, and cloud data strategies into one coherent analytics operating model.
Reports Should Be Built for Decisions, Not Downloads
Automation changes everything.
Custom Power BI reports
We build automated reports that surface exceptions, risks, and trends — so admins act before problems escalate.
Advanced Tableau Calculations Still Have a Role
Some insights require deep Tableau expertise.
Tableau LOD Calculation Expert
VisualizExpert applies LOD calculations to analyze user behavior, content performance, and site-level trends accurately.
Performance Is a Governance Issue
Slow dashboards reduce trust.
Tableau Server Optimization
Using observability data, we identify performance bottlenecks and optimize Tableau environments proactively.
Finance Teams Need Analytics They Can Rely On
Governance directly impacts financial confidence.
Tableau for Finance Dashboards
We help finance teams monitor data freshness, access controls, and reporting reliability — reducing operational risk.
Supporting Teams Beyond Initial Deployment
BI maturity is a journey.
Tableau Desktop Developer Services
Our developers support ongoing enhancements, refactoring, and optimization as Tableau usage evolves.
Why VisualizExpert
VisualizExpert doesn’t just build dashboards — we design analytics systems that scale. By combining Tableau’s Platform Data API with enterprise-grade modeling, visualization, and governance expertise, we help organizations move from reactive BI firefighting to proactive, decision-ready analytics.
If your Tableau Cloud deployment is growing, your observability strategy needs to grow with it.
Get expert guidance from VisualizExpert — and build BI that stays valuable at scale.
Leave a Reply