Modern founders don’t lack dashboards. They lack clarity.
Every week, reports land in inboxes. Revenue summaries. CAC breakdowns. Funnel snapshots. Yet the most common question remains unanswered:
“So… what should we do next?”
This is where many data initiatives quietly fail. Not because of bad tools or missing metrics — but because founders are trained to ask for reports instead of asking better questions.
At VisualizExpert, we see this pattern across companies investing heavily in data analytics services. Dashboards exist. Data pipelines run. But decisions still lag. The real gap isn’t visibility — it’s intent.
This article explains why reports are no longer enough, how better questions unlock better outcomes, and how modern analytics — done right — supports founders at the moment decisions are made.
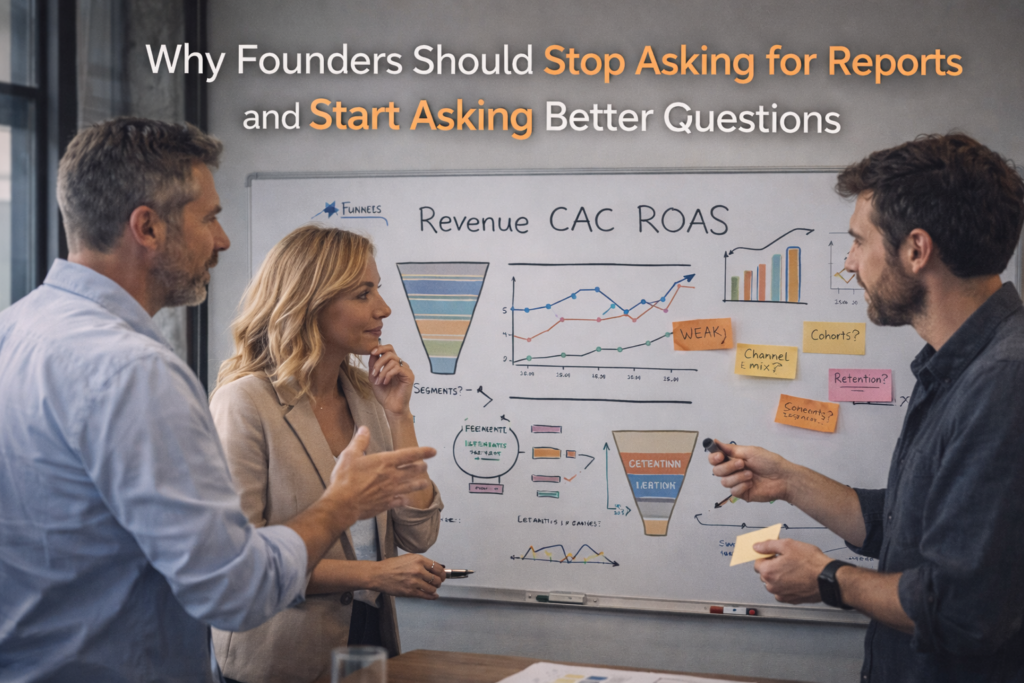
The Hidden Problem With “Can I Get a Report?”
A report is an output. A question is a direction.
When founders ask for reports, they unknowingly push teams into reactive mode. Data teams scramble to pull numbers. Analysts interpret results. By the time insights surface, the context has already shifted.
This is why many Power BI dashboards and analytics tools feel underwhelming. They weren’t designed to answer questions — they were designed to summarize activity.
The result?
- Lagging indicators instead of leading signals
- Retrospective insights instead of real-time guidance
- More explanation, less action
The issue isn’t reporting quality. It’s the mental model behind reporting.
Data Analytics Services Should Support Questions, Not Just Charts
The most effective data analytics services start by reframing the conversation.
Instead of:
- “Can I see last month’s performance?”
- “Can you send the CAC report?”
- “Why don’t these numbers match?”
High-performing founders ask:
- “Which customer segments are scaling profitably?”
- “Where are we overspending relative to retention?”
- “What changed this week that could impact next quarter?”
This shift changes everything.
Dashboards stop being static summaries and become decision tools. Metrics align around intent. Teams move faster because they’re solving the right problems, not just delivering outputs.
Why Reports Create Distance Between Founders and Decisions
Traditional reporting creates a translation layer:
Business question → analyst interpretation → data model → visualization → explanation → decision
Each step introduces delay and ambiguity.
Even the best business intelligence consulting can’t fully compensate if dashboards are built around reports instead of questions. Founders end up consuming information instead of engaging with insight.
This is why many executives feel disconnected from their own data — despite having access to dozens of dashboards.
How Executive Analytics Dashboards Change the Dynamic
Well-designed executive analytics dashboards reverse this flow.
Instead of asking teams for reports, founders interact directly with outcomes:
- Growth vs profitability tradeoffs
- Channel performance in context
- Customer behavior over time
These dashboards are intentionally minimal. They surface only what matters most, aligned to leadership decisions — not operational noise.
At VisualizExpert, this is where custom Power BI consulting becomes critical. Executive dashboards require a different design philosophy than operational reports. They prioritize clarity, trust, and speed over completeness.
Asking Better Questions Starts With the Right Data Model
Behind every great dashboard is a solid foundation.
Strong Power BI data modeling services ensure metrics behave consistently across views. Revenue means the same thing everywhere. CAC isn’t recalculated five different ways. Cohorts remain stable.
This structure allows founders to explore data without fear of misinterpretation — turning dashboards into safe environments for strategic thinking.
Without this foundation, even the most polished visuals fail to support confident decisions.
Interactive Business Dashboards Replace Static Reporting
Static reports answer one question once.
Interactive business dashboards allow founders to explore why something happened — and what to do next. Filters, drill-downs, and comparisons enable curiosity without friction.
This is where analytics shifts from consumption to collaboration.
Founders don’t wait for explanations. They discover insights themselves.
KPI Dashboard Services That Align With Strategy
Most KPI dashboards track activity. Few track progress.
Effective KPI dashboard services align metrics to strategic goals:
- Are we growing efficiently?
- Are customers staying longer?
- Is revenue quality improving?
When KPIs reflect strategy, founders naturally ask better questions — because the dashboard mirrors how they think about the business.
Decision-Ready Data Visualization Matters More Than Volume
More data doesn’t create better decisions. Decision-ready data visualization does.
Clean layouts. Clear hierarchies. Contextual benchmarks.
This is the difference between “interesting data” and actionable insight. It’s where data visualization services meet leadership psychology.
Good dashboards reduce cognitive load. Great dashboards reduce hesitation.
Why Power BI Managed Services Support Long-Term Clarity
As businesses evolve, questions change.
New markets. New pricing models. New growth levers.
Without ongoing support, dashboards slowly drift out of alignment. Metrics lose relevance. Trust erodes.
This is why Power BI Managed Services matter — not just for maintenance, but for continuity. Dashboards must evolve alongside strategy to remain useful.
When Founders Stop Asking for Reports, Teams Move Faster
When founders ask better questions:
- Data teams focus on insight, not extraction
- Analysts spend less time reconciling numbers
- Leadership conversations shift from explanation to action
This is the true ROI of analytics — not prettier dashboards, but organizational velocity.
How VisualizExpert Approaches Founder-Level Analytics
At VisualizExpert, we design analytics around how leaders think, not how tools work.
As a specialized Data Analytics Agency, our approach blends:
- Business intelligence consulting
- Custom Power BI reports aligned to decisions
- Scalable data models and governance
- Executive-ready dashboards built for clarity
We don’t start with visuals. We start with questions.
Final Thoughts: Reports Don’t Build Companies — Decisions Do
Founders don’t win by knowing more.
They win by knowing what matters now.
If your analytics still revolve around reports, the limitation isn’t your data — it’s the questions being asked.
When dashboards are designed to answer better questions, insight becomes immediate, decisions become confident, and growth becomes intentional.
That’s where analytics stops being a function — and starts becoming a leadership advantage.
👉 Learn how VisualizExpert helps founders move from reporting to real decision-making
Leave a Reply