Blog

  • Power BI Dashboard Development for Decision-Ready Enterprises in 2026


    In 2026, enterprises are no longer asking whether they need analytics — they’re asking why their dashboards still don’t drive decisions.

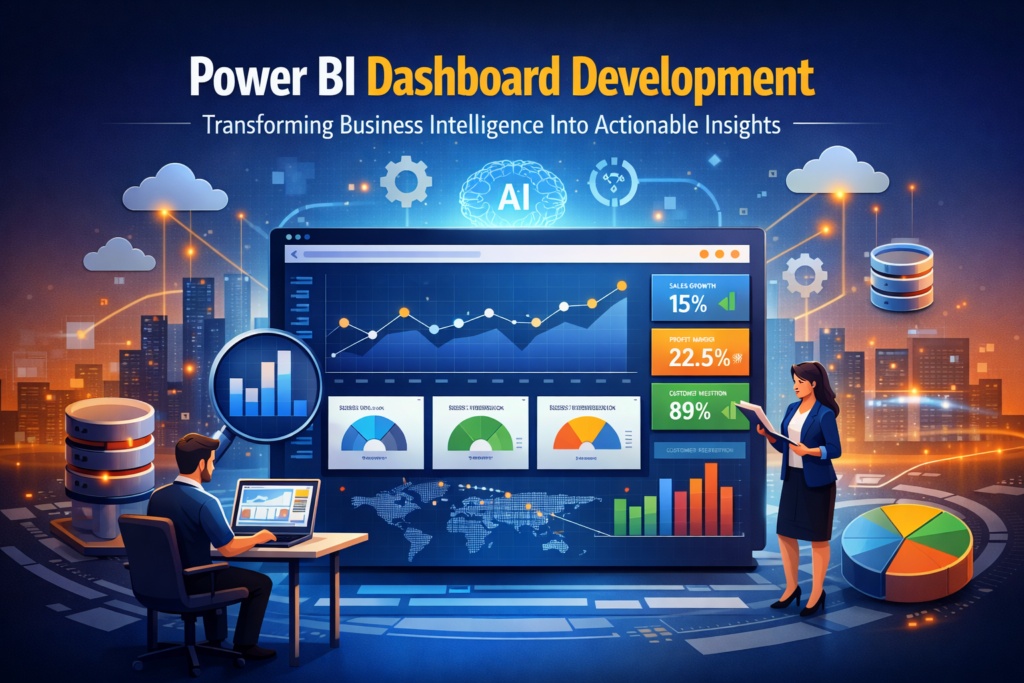
    Despite heavy investments in BI tools, leadership teams often face delayed insights, conflicting metrics, and dashboards that explain what happened but fail to guide what to do next. This is where Power BI dashboard development evolves from reporting into a strategic capability.

    At Visualizexpert, we help enterprises move beyond static BI by designing analytics systems built for clarity, performance, and decision confidence.


    Why Business Intelligence in 2026 Is About Outcomes, Not Tools

    Modern organizations generate data across CRMs, ERPs, marketing platforms, finance systems, and operational tools. The challenge is no longer access — it’s alignment.

    This is why business intelligence consulting has shifted focus from dashboards to decision frameworks. Enterprises now expect BI to:

    • Reduce decision latency
    • Align KPIs across teams
    • Surface risks before they escalate
    • Enable leadership to act with confidence

    Dashboards that don’t support these outcomes are no longer acceptable.


    Power BI Dashboard Development: From Reports to Decision Systems

    What’s Changed?

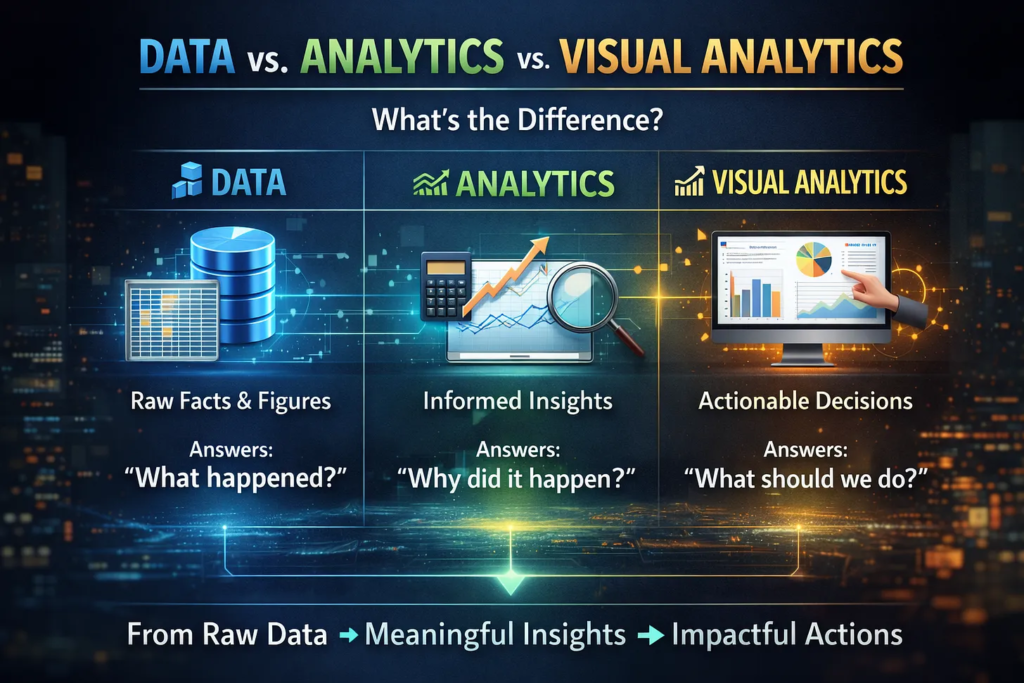
    Traditional dashboards answered, “What happened?”
     Modern dashboards must answer:

    • Why did it happen?
    • What will happen next?
    • What action should we take?

    Effective Power BI dashboard development in 2026 requires more than visuals — it requires architecture, modeling, and performance discipline.

    Core Principles We Apply

    • Business-aligned KPIs over metric overload
    • Contextual benchmarks instead of isolated numbers
    • Role-based views for executives, managers, and operators

    This approach transforms dashboards into interactive business dashboards that leaders can trust.


    Building the Right Foundation with Power BI Data Modeling Services

    A dashboard is only as accurate as its data model.

    Many enterprises struggle with:

    • Incorrect totals
    • Broken filters
    • Slow performance at scale

    Our Power BI data modeling services focus on creating scalable, enterprise-grade semantic layers that ensure:

    • Consistent definitions across departments
    • Reliable aggregations
    • Faster query performance

    We often implement Power BI Star Schema Design to simplify relationships and improve calculation accuracy across large datasets.


    Designing Executive Analytics Dashboards That Drive Action

    Executives don’t need more data — they need clarity.

    High-impact executive analytics dashboards are designed around:

    • Strategic KPIs
    • Trends and deltas
    • Exceptions and risks

    At Visualizexpert, we design dashboards that:

    • Highlight what changed
    • Show why it matters
    • Make priorities obvious within seconds

    This is where decision-ready data visualization becomes a competitive advantage.


    Performance at Scale with Power BI DirectQuery Performance

    As enterprises scale, performance issues often surface:

    • Slow refresh times
    • Lagging visuals
    • Timeout errors on large datasets

    We optimize Power BI DirectQuery performance by:

    • Redesigning models for query efficiency
    • Reducing cardinality issues
    • Implementing aggregation strategies
    • Aligning visuals with query behavior

    This ensures dashboards remain responsive even with millions of records and real-time data sources.


    Security and Governance with Power BI Row Level Security

    Data democratization without governance creates risk.

    Enterprises must ensure users see only the data they’re authorized to access — without duplicating dashboards.

    We implement Power BI Row Level Security to:

    • Protect sensitive financial, HR, and customer data
    • Support multi-region and multi-role access
    • Maintain a single source of truth

    Governance-first BI builds trust — both with leadership and regulators.


    From Excel to Enterprise BI: Power BI Migration from Excel

    Many organizations still rely on Excel for critical reporting — creating:

    • Version conflicts
    • Manual errors
    • Delayed insights

    Our Power BI Migration from Excel services help enterprises:

    • Centralize reporting
    • Automate refreshes
    • Preserve logic while improving scalability

    The result is a shift from spreadsheet dependency to Power BI dashboards built for collaboration and control.


    Power BI Embedded Analytics for Product-Led Insights

    For SaaS platforms and internal portals, analytics must live inside the product experience.

    With Power BI Embedded Analytics, we enable organizations to:

    • Deliver analytics to customers or internal users
    • Maintain branding consistency
    • Control performance and access at scale

    Embedded BI turns analytics into a product feature — not a separate tool.


    KPI Strategy Consulting: Aligning Metrics with Business Reality

    Dashboards fail when KPIs are misaligned.

    Our KPI strategy consulting ensures that:

    • Metrics reflect business goals
    • Definitions are consistent across teams
    • Vanity metrics are eliminated

    This creates Power BI KPI tracking systems that leadership can actually rely on.


    Beyond Power BI: Advanced Visualization Capabilities

    While Power BI is core for many enterprises, some use cases demand advanced storytelling and exploration.

    We support:

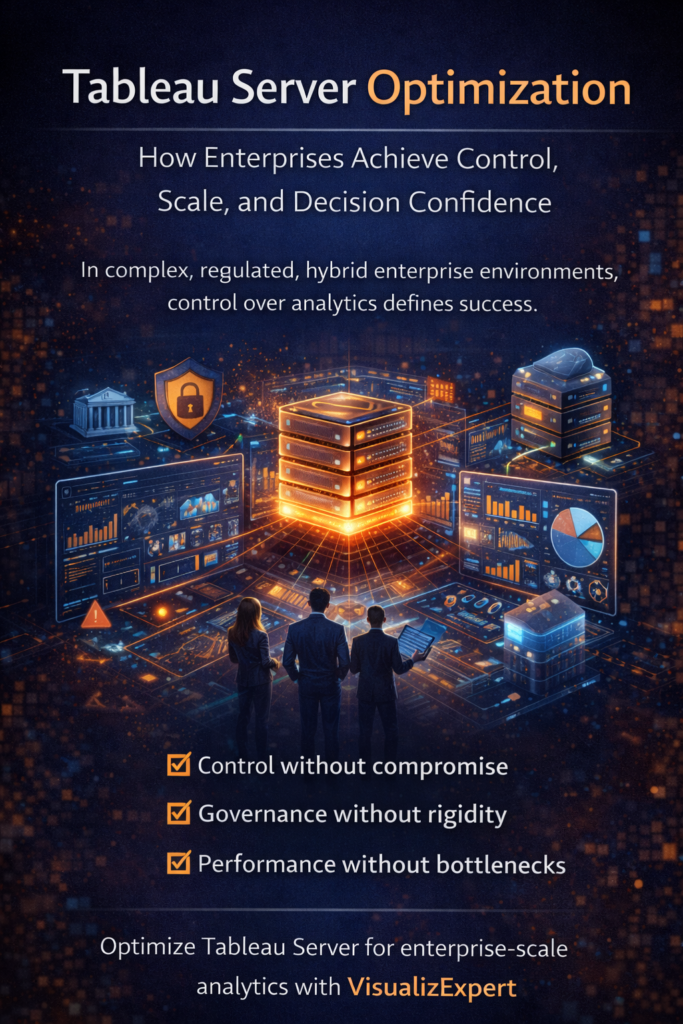
    • Tableau Dashboard Design for visual exploration
    • Tableau Server Optimization for enterprise performance
    • Looker Studio Marketing Reports for marketing and growth teams

    Each tool is selected based on decision context — not preference.


    API Integration Services and Unified Reporting

    Disconnected systems slow decision-making.

    Our API Integration Services and automated data pipeline engineering unify data across:

    • CRM and ERP
    • Marketing and sales platforms
    • Finance and operations

    This enables unified reporting data models that eliminate reconciliation debates and restore trust in numbers.


    Enterprise BI Managed Services for Long-Term Success

    BI is not a one-time project.

    Our Enterprise BI Managed Services support:

    • Performance monitoring
    • KPI evolution
    • Dashboard optimization
    • Governance enforcement

    This ensures analytics systems evolve as the business grows.

    Final Thought

    In 2026, enterprises won’t win by collecting more data — they’ll win by making faster, clearer decisions with the data they already have.

    If your dashboards still need explanation, your analytics strategy needs refinement.

    Book a free consultation with Visualizexpert to evaluate your current BI setup, uncover performance gaps, and design a decision-ready analytics roadmap built for scale, security, and leadership confidence.

  • Why Disconnected Systems Are Draining Business Efficiency — And How API Integration Services Fix It


    Introduction: The Real Cost of Disconnected Systems

    Most enterprises don’t suffer from a lack of technology.
     They suffer from too much technology that doesn’t work together.

    Across finance, sales, operations, marketing, and customer support, systems multiply quickly. Each tool solves a local problem. But collectively, they create a global one: fragmentation.

    This is where API Integration Services become essential — not as a technical upgrade, but as a strategic response to hidden inefficiencies that slow execution, dilute accountability, and erode decision confidence.

    Disconnected systems don’t fail loudly.
     They fail quietly — through delays, manual work, conflicting reports, and leadership decisions made on partial truth.


    The Efficiency Drain No One Sees Until It’s Too Late

    In large organizations, inefficiency rarely shows up as a single failure. It appears as:

    • Reports that take days instead of minutes
    • Teams are reconciling numbers instead of acting on them
    • Leaders are questioning which dashboard is “right.”
    • IT is spending more time maintaining integrations than enabling growth

    Each department operates with its own systems, data definitions, and timelines. The result is operational drag — where execution slows not because people are incapable, but because systems are misaligned.

    Disconnected systems create three compounding costs.


    1. Operational Friction: Where Time and Focus Are Lost

    Every system boundary introduces friction.

    A deal closes in sales, but finance doesn’t see it immediately.
     A customer issue is resolved in support, but marketing still targets them incorrectly.
     Inventory changes, but procurement works from yesterday’s data.

    Employees switch between tools constantly, re-entering data, exporting spreadsheets, and validating numbers. The organization spends energy moving information, not using it.

    This friction compounds daily, reducing productivity, increasing errors, and exhausting teams.


    2. Data Trust Erosion: When Numbers Compete Instead of Align

    When systems don’t share a common data backbone, each becomes its own version of reality.

    The same metric appears differently across dashboards.
     Definitions vary by department.
     Leadership meetings turn into debates about data accuracy instead of strategy.

    Once trust erodes, analytics adoption drops.
     People revert to intuition — not because they dislike data, but because they no longer trust it.

    At enterprise scale, loss of data trust is a strategic risk.


    3. Decision Latency: The Hidden Strategic Cost

    Disconnected systems slow insight generation.

    Cross-functional questions — those that matter most — take the longest to answer. By the time reports are compiled, validated, and shared, the opportunity has passed.

    Organizations operating this way don’t lack intelligence.
     They lack decision velocity.

    This is where integration stops being optional.


    Why API Integration Alone Is Not Enough

    Many enterprises attempt to solve fragmentation by “connecting” systems.

    APIs are built.
     Data is synced.
     Dashboards pull from multiple sources.

    This helps — but only partially.

    Traditional integration connects systems without changing the underlying reality:

    • Each tool still owns its own data
    • Syncs introduce delays and failure points
    • Breakages require constant IT intervention

    APIs move data — but they don’t guarantee consistency, context, or confidence.

    This is the difference between integration and unification.


    How API Integration Services Enable Enterprise Unification

    True API Integration Services go beyond connecting tools. They are designed to orchestrate data flow, enforce governance, and support a unified analytical layer across the organization.

    At an enterprise level, an effective API strategy focuses on:

    • Standardized data models across systems
    • Real-time or near-real-time data availability
    • Clear ownership of metrics and definitions
    • Scalable pipelines that don’t break with growth

    Instead of each system acting independently, APIs become part of a cohesive data architecture.

    This is how complexity is reduced — not added.


    What Unified Systems Unlock for Enterprises

    When systems are properly unified through robust API architecture, organizations experience measurable change:

    1. One Source of Truth

    All analytics draw from consistent, governed data. Teams stop reconciling numbers and start aligning decisions.

    2. Real-Time Visibility

    Executives no longer wait for weekly or monthly reports. Dashboards reflect current operational reality.

    3. Faster Cross-Functional Decisions

    Sales, finance, operations, and marketing operate from shared context — eliminating handoff delays.

    4. Reduced Manual Work

    Automated data movement replaces spreadsheets, exports, and re-entry — freeing teams for higher-value work.

    5. Scalable Growth

    New tools and data sources can be added without destabilizing the system.


    Why Enterprises Need Analytics-Led Integration, Not Tool-Led Integration

    A common mistake is treating integration as an IT project.

    In reality, integration is a business intelligence initiative.

    APIs should be designed around:

    • How decisions are made
    • Which metrics drive action
    • Who needs what data, when, and why

    Without this lens, integrations technically work — but strategically fail.

    This is why enterprises increasingly partner with analytics-first firms that understand data flow, reporting architecture, and executive decision needs, not just APIs.


    Governance, Security, and Control at Scale

    Enterprise environments demand more than connectivity.

    They require:

    • Controlled access
    • Auditability
    • Compliance with internal and external regulations
    • Predictable performance under high usage

    Well-architected API frameworks support:

    • Secure data access across systems
    • Role-based exposure of sensitive information
    • Centralized monitoring and failure handling

    This ensures integration strengthens governance rather than undermining it.


    Preparing for AI and Advanced Analytics

    As organizations move toward AI-assisted decision-making, fragmented data becomes a liability.

    AI models trained on inconsistent or delayed data amplify errors instead of insights.

    Unified, API-driven architectures provide:

    • Clean, reliable input for analytics and AI
    • Traceable data lineage
    • Confidence in automated recommendations

    Integration is no longer just about efficiency — it’s about future readiness.


    Final Thoughts: Simplification Is a Strategic Advantage

    Disconnected systems don’t just slow operations.
     They limit what an organization can see, decide, and execute.

    Enterprises that succeed don’t add more tools — they simplify how systems work together.

    This is where the right integration strategy becomes transformational.

    At VisualizExpert, API integration is approached as part of a broader analytics and decision-enablement strategy. We help enterprises design integration frameworks that don’t just move data — but create clarity, restore trust, and accelerate decisions.

    Because real efficiency doesn’t come from doing more.
     It comes from removing the friction that prevents your business from moving forward.

  • Tableau Server Optimization: How Enterprises Achieve Control, Scale, and Decision Confidence

    The Enterprise Analytics Reality Has Changed

    In large enterprises, analytics challenges rarely come from a shortage of dashboards or tools. They come from complexity at scale.

    Data is no longer centralized in one place. It spans on-premises systems, private cloud environments, regulated data zones, and multiple public cloud platforms. Different teams consume analytics differently. Some require rapid experimentation. Others demand strict governance, auditability, and compliance.

    At this level of maturity, analytics stops being about visualization alone.
     It becomes a question of control without compromise.

    This is why Tableau Server Optimization has become a strategic priority for enterprises that operate in hybrid environments and cannot afford performance bottlenecks, governance gaps, or trust erosion in decision-making.


    Why Cloud-Only Analytics Often Breaks at Enterprise Scale

    Cloud BI platforms deliver speed and accessibility — but they are not designed for every enterprise reality.

    As organizations scale, analytics decisions increasingly resemble infrastructure decisions. Common enterprise constraints include:

    • Data residency and sovereignty requirements
    • Sensitive data that cannot leave controlled environments
    • Security teams requiring ownership over access, identity, and network policies
    • Performance challenges under high concurrency and large data volumes
    • Upgrade cycles that must align with internal governance and change management

    In these scenarios, SaaS-only analytics models often introduce risk, latency, or loss of control.

    A self-managed analytics platform — properly optimized — addresses these challenges without sacrificing usability or speed.


    What Optimized Tableau Server Delivers for Enterprises

    Tableau Server, when implemented and optimized correctly, becomes more than a reporting layer. It becomes an enterprise analytics foundation.

    Optimized deployments allow organizations to:

    • Run analytics entirely within controlled environments
    • Enforce enterprise-grade security and access policies
    • Scale horizontally to support thousands of concurrent users
    • Maintain predictable performance as data volumes grow
    • Align analytics operations with internal IT governance

    This level of control is not about flexibility for convenience — it is about risk management, compliance, and operational confidence.


    Tableau Server Optimization and Enterprise Self-Service Analytics

    One of the most difficult challenges in large organizations is balancing self-service analytics with centralized governance.

    Without self-service:

    • Analytics teams become bottlenecks
    • Business users wait for reports
    • Decisions slow down

    Without governance:

    • Metrics diverge across teams
    • Trust in data erodes
    • Leadership questions the numbers

    Optimized Tableau Server environments enable both.

    Business users explore and interact with trusted data independently, while IT and data teams retain centralized control over certified data sources, definitions, permissions, and performance tuning.

    The result is faster decisions without fragmented truth.


    Analytics Embedded Where Enterprise Decisions Actually Happen

    In mature organizations, decisions rarely happen inside BI tools alone.

    They happen inside:

    • Internal enterprise platforms
    • Customer-facing portals
    • Operational and workflow systems
    • Secure, role-based applications

    An optimized Tableau Server environment enables analytics to be embedded directly into these systems — ensuring insights are available in the flow of work, not buried behind separate logins or tools.

    This significantly increases adoption and ensures analytics influences real operational decisions rather than becoming passive reports.


    Performance, Scale, and Reliability at High Concurrency

    As usage expands across regions, departments, and leadership layers, performance becomes a strategic concern.

    Tableau Server Optimization focuses on:

    • Deploying analytics close to enterprise data sources
    • Reducing latency through architecture and caching strategies
    • Supporting high concurrency without dashboard degradation
    • Scaling clusters to handle peak workloads reliably

    This ensures analytics remains responsive even as enterprise demand grows — preventing slow dashboards from becoming a silent decision bottleneck.


    Governance Builds Trust — and Trust Accelerates Decisions

    Enterprise analytics only succeeds when leaders trust the data.

    Optimized Tableau Server environments support this trust by enabling:

    • Enterprise-grade access controls
    • Centralized governance and metadata management
    • Clear lineage and ownership of analytics assets
    • Consistent definitions across teams and regions

    Governance does not slow analytics when implemented correctly.
     It stabilizes decision-making, allowing organizations to move faster with confidence.


    Preparing Enterprise Analytics for an AI-Driven Future

    As enterprises integrate AI into analytics, governance and security become even more critical.

    By hosting analytics within managed environments, organizations can:

    • Integrate AI responsibly without exposing sensitive data
    • Maintain policy enforcement and auditability
    • Experiment with AI-driven insights safely
    • Build a controlled foundation for future innovation

    This makes optimized Tableau Server deployments a strategic enabler, not a temporary solution.


    Why Enterprises Partner with VisualizExpert

    VisualizExpert works with enterprises that view analytics as a long-term capability — not a one-time dashboard project.

    We help organizations:

    • Architect and optimize Tableau Server for scale and reliability
    • Align analytics infrastructure with governance and compliance needs
    • Design enterprise dashboards that leaders actually trust and use
    • Reduce performance bottlenecks and adoption friction
    • Build analytics systems that evolve with the business

    We don’t just optimize servers.
     We optimize how analytics supports decision-making at scale.

    Final Thoughts

    In complex, regulated, hybrid enterprise environments, analytics success is not about adopting the newest BI tool.

    It’s about choosing the right control model.

    With proper Tableau Server Optimization, enterprises can:

    • Scale analytics without losing governance
    • Empower users without fragmenting truth
    • Innovate without compromising security

    When analytics platforms adapt to the business — rather than forcing the business to adapt — data becomes a strategic advantage instead of an operational risk.

    At VisualizExpert, we help enterprises design, optimize, and scale Tableau Server environments that leaders trust, teams adopt, and security teams approve. Our focus is not just performance or visuals — but building analytics systems that support confident, enterprise-grade decision-making.

    If your analytics environment is growing in complexity, optimization is no longer optional.
     It’s foundational — and VisualizExpert is built to help you get it right.

  • How Founders Can Spot Bottlenecks Before They Hurt Growth Using Executive Analytics Dashboards


    Growth Rarely Breaks Overnight — It Quietly Slows Down

    Most founders don’t wake up to a sudden growth crisis.
     Revenue doesn’t collapse in a single quarter. Customers don’t disappear in a week.

    Instead, growth gradually slows — buried under operational friction, unclear metrics, and dashboards that report activity instead of insight.

    This is where executive analytics dashboards become critical. Not as reporting tools, but as early-warning systems. When designed correctly, dashboards help founders spot bottlenecks before they damage momentum, cash flow, or team morale.

    At scale, growth bottlenecks are not operational accidents. They are visibility failures.


    Why Founders Miss Bottlenecks Even When They “Have Data”

    Most growing companies already invest in data visualization services, reporting tools, and dashboards. Yet bottlenecks still slip through.

    The problem isn’t data volume.
     It’s data relevance.

    Common reasons bottlenecks go unnoticed:

    • Dashboards show what happened, not where pressure is building
    • Metrics are siloed across sales, marketing, and operations
    • Founders see too many numbers but too few signals
    • Reports are built for teams, not leadership decisions

    This is where business intelligence consulting shifts from reporting to strategy — helping founders focus on constraints, not clutter.


    Bottlenecks Are Patterns, Not Single Metrics

    A bottleneck is rarely one bad number.
     It’s a pattern across systems.

    For example:

    • Marketing leads are growing, but sales velocity is flat
    • Revenue is rising, but cash flow is tightening
    • Customer acquisition improves, but retention quietly drops

    These signals only surface when dashboards are built with contextual relationships, not isolated KPIs.

    This is the difference between basic BI dashboard solutions and decision-ready data visualization.


    Using KPI Dashboard Services to Detect Bottlenecks Early

    Effective KPI dashboard services don’t aim to track everything. They are designed to expose constraints in the growth engine.

    For founders, the most common bottleneck zones include:

    • Demand flow: Lead quality, conversion velocity, pipeline aging
    • Revenue realization: Discounting, margin compression, delayed collections
    • Operations: Fulfillment delays, capacity strain, rising cost per unit
    • Retention: Churn signals hidden behind top-line growth

    Dashboards that connect these metrics reveal where growth is slowing — before results collapse.


    Why Executive Dashboards Should Reduce Data, Not Add More

    Founders don’t need diagnostic depth.
     They need directional clarity.

    High-performing executive dashboards share three traits:

    1. Few metrics, high meaning
    2. Trend-based views instead of raw tables
    3. Visual hierarchy that surfaces risk instantly

    This is where interactive business dashboards outperform static reports — allowing founders to drill only when something breaks pattern.


    Spotting Bottlenecks Across the Growth Funnel

    Bottlenecks shift as companies scale. Dashboards must evolve with them.

    Early-Stage Growth

    • Lead velocity vs. sales capacity
    • Conversion drop-offs by stage

    Scale-Up Phase

    • Revenue per customer vs. acquisition cost
    • Operational throughput vs. demand

    Mature Growth

    • Retention erosion
    • Margin dilution
    • Forecast accuracy gaps

    Dashboards that fail to evolve often mask bottlenecks rather than expose them.


    Why Automation Alone Doesn’t Solve Visibility Problems

    Many founders invest in Power BI dashboards or automated reporting, expecting clarity to improve automatically.

    Automation removes manual work — not confusion.

    Without intentional design:

    • Automated reports amplify noise
    • Dashboards refresh faster, but stay misaligned
    • Founders react late, not early

    This is why analytics and reporting consulting matters. It ensures automation supports decisions, not distractions.


    Turning Dashboards into Constraint-Focused Systems

    Advanced teams design dashboards around constraints, not departments.

    This includes:

    • Linking sales velocity to delivery capacity
    • Mapping marketing spend to cash-flow impact
    • Aligning hiring pace with revenue predictability

    This systems view is central to enterprise data visualization — even for mid-market and founder-led companies.


    Data Modeling Matters More Than Chart Design

    Many bottlenecks remain invisible because dashboards are built on weak models.

    Strong dashboards rely on:

    • Clean metric definitions
    • Consistent time granularity
    • Unified reporting layers

    This foundation enables custom analytics solutions that scale without breaking trust.


    Bottlenecks Across Teams Need Shared Visibility

    Growth constraints rarely belong to one team.

    Sales feels the pain.
     Operations absorb the pressure.
     Finance sees the impact last.

    Dashboards must create shared accountability, not departmental silos. This is why founders benefit from shareable stakeholder reports that align teams around the same truth.


    From Reactive Reporting to Proactive Leadership

    Founders who spot bottlenecks early share one habit:
     They don’t wait for performance reviews to learn what’s broken.

    They rely on:

    • Continuous visibility
    • Leading indicators
    • Scenario-aware dashboards

    This mindset shift is at the heart of data-driven decision making.


    Governance: Visibility Without Overexposure

    While visibility matters, not all data belongs on executive screens.

    Effective dashboards:

    • Hide operational noise
    • Surface decision-level signals
    • Protect sensitive details

    This balance is essential for long-term trust in analytics.


    Why Bottleneck Detection Is a Strategic Advantage

    Companies that detect constraints early:

    • Reallocate resources faster
    • Avoid panic hiring or spending
    • Protect margins during scale

    This is why bottleneck-focused dashboards are not reporting tools — they’re growth insurance.


    How VisualizExpert Helps Founders Stay Ahead of Bottlenecks

    At VisualizExpert, we help founders move beyond static dashboards to decision-ready analytics systems.

    Our work focuses on:

    • Designing executive analytics dashboards aligned to growth stages
    • Building KPI frameworks that expose constraints early
    • Creating scalable reporting models that evolve with the business
    • Delivering clarity without overwhelming leadership

    We don’t build dashboards for presentation.
     We build dashboards for foresight.


    Final Thoughts: Growth Slows When Bottlenecks Go Unseen

    Bottlenecks don’t announce themselves.
     They hide in trends, timing gaps, and misaligned metrics.

    Founders who rely on surface-level dashboards see problems late.
     Founders who invest in constraint-aware analytics act early.

    If your dashboards show activity but not friction, growth risk is already accumulating.

    VisualizExpert helps founders design analytics systems that surface bottlenecks before they hurt growth — turning dashboards into strategic assets, not reporting overhead.

  • 11 Data Visualization Techniques for Every Use Case (With Real Business Examples)


    Why Data Visualization Is No Longer Optional

    Modern businesses are drowning in dashboards but starving for clarity.

    Every department has data.
     Every tool promises insights.
     Yet leaders still ask, “What should we do next?”

    This gap exists because data visualization for decision making isn’t about charts — it’s about cognitive clarity. At VisualizExpert, we see this daily: organizations don’t fail due to a lack of data; they fail because visuals don’t support decisions.

    Effective visualization compresses complexity into patterns the human brain can instantly recognize. When done right, it shortens meetings, aligns teams, and accelerates action.


    From Analysis to Action: Where Visualization Fits

    Before diving into techniques, it’s important to understand why visualization matters.

    • Data captures what happened
    • Analytics explains why it happened
    • Visualization enables decisions on what to do next

    This is the foundation of data-driven decision making — and the reason visual analytics has moved from “nice-to-have” to mission-critical.


    11 Data Visualization Techniques That Actually Work

    Below are 11 visualization techniques, mapped to real business use cases — not theory.


    1. Line Charts — Tracking Change Over Time

    Best for: Trends, growth, seasonality

    Line charts are ideal when leadership needs to understand momentum. Revenue growth, traffic trends, or cost movement over time become immediately visible.

    Used heavily in executive analytics dashboards, line charts answer one question fast: Are we improving or declining?


    2. Bar Charts — Comparing Categories

    Best for: Rankings, comparisons

    Bar charts excel at showing differences between categories — regions, products, channels, or teams. When paired with KPI dashboard services, they help leaders spot underperformance instantly.


    3. Histograms — Understanding Distribution

    Best for: Frequency, spread, anomalies

    Histograms reveal whether results are consistent or volatile. They’re commonly used in analytics and reporting consulting to identify skewed performance or outliers that averages hide.


    4. Box Plots — Spotting Risk and Variability

    Best for: Outliers, variability

    Box plots are powerful in finance, operations, and HR analytics where understanding risk dispersion matters more than averages.


    5. Scatter Plots — Revealing Relationships

    Best for: Correlation, hypothesis testing

    Scatter plots expose relationships between variables — such as spend vs. return or speed vs. quality. They are often used in custom analytics solutions to validate assumptions before scaling decisions.


    6. Heatmaps — Pattern Recognition at Scale

    Best for: Density, intensity, behavior patterns

    Heatmaps allow instant recognition of peaks and gaps. From user behavior to performance tracking, they’re widely used in interactive business dashboards where speed of interpretation matters.


    7. Treemaps — Part-to-Whole Analysis

    Best for: Portfolio breakdowns

    Treemaps are ideal when showing how components contribute to a whole — budget allocation, product mix, or revenue contribution. They often replace pie charts in enterprise data visualization due to better readability.


    8. Geospatial Maps — Location-Based Insight

    Best for: Regional performance

    Maps make geography actionable. Sales coverage, logistics efficiency, and market penetration come alive when layered onto spatial visuals — especially in BI dashboard solutions.


    9. Network Diagrams — Relationship Mapping

    Best for: Connections, dependencies

    Network diagrams are powerful for fraud detection, supply chains, or organizational analysis. They reveal structures that tables cannot, often forming part of business intelligence consulting engagements.


    10. Bullet Charts — Performance vs Target

    Best for: KPI tracking

    Bullet charts replace cluttered gauges and are excellent for compact dashboards. They’re frequently used in Power BI Dashboard Development to show actuals versus targets without visual noise.


    11. Dashboards — Decision Systems, Not Reports

    Best for: Ongoing monitoring

    Dashboards aren’t a visualization type — they’re a system. Effective dashboards combine multiple techniques into a narrative aligned with business goals. The best ones focus on decision-ready data visualization, not reporting volume.


    Choosing the Right Visualization (H2 with keyword)

    Decision-Ready Data Visualization: How to Choose What Actually Works

    (Keyword used: Decision-Ready Data Visualization)

    Choosing the wrong chart can destroy even the best analysis.

    Ask these questions before selecting a visualization:

    1. What decision should this support?
    2. Who is the audience?
    3. How fast must the insight be understood?
    4. What action should follow?

    This approach is central to dashboard design consulting, where clarity always beats complexity.


    Tools Matter — but Strategy Matters More

    Tools like Power BI, Tableau, and Looker Studio have democratized visualization. But tools alone don’t guarantee impact.

    Successful organizations invest in:

    • Power BI consulting services to align visuals with strategy
    • Tableau Dashboard Design for storytelling and exploration
    • data visualization services that focus on adoption, not aesthetics

    Without a strategy, dashboards become unused artifacts.


    Best Practices That Separate Good from Great

    Based on real-world delivery experience, here’s what works:

    • One insight per visual
    • Consistent color logic
    • Minimal cognitive load
    • Clear visual hierarchy
    • Metrics tied to accountability

    These principles underpin interactive dashboard design and ensure visuals guide action — not confusion.


    Scaling Visualization Across the Organization

    As organizations mature, visualization must scale:

    • Across departments
    • Across roles
    • Across decision levels

    This is where KPI strategy consulting and analytics strategy services help standardize metrics while allowing flexibility for different users.

    The goal isn’t more dashboards — it’s fewer, trusted ones.


    Why Visualization Is a Leadership Skill Now

    Visualization is no longer just for analysts.

    Executives rely on executive summary dashboards to:

    • Reduce meeting time
    • Align priorities
    • Act with confidence

    That’s why visualization has become a core pillar of analytics transformation consulting — it directly affects decision velocity.


    Final Thought: Where Better Decisions Actually Begin

    Data visualization isn’t about prettier charts.
     It’s about confidence, speed, and alignment.

    When leaders can see what matters, decisions stop being debated and start being executed. That’s how organizations move faster — without guessing.

    If your dashboards still explain the past instead of guiding the next move, it’s time to rethink how you visualize.

    👉 VisualizExpert helps teams design decision-ready dashboards that don’t just display data — they drive action.
     From strategy to execution, the focus stays the same: clarity that scales with growth.

    Because the real value of data isn’t knowing more.
     It’s about making better decisions — every single day.

  • Data vs. Analytics vs. Visual Analytics: Turning Information into Decisions That Scale


    Introduction: Why Data Alone Is No Longer Enough

    Most organizations today are drowning in data — but still starving for clarity. Spreadsheets, dashboards, and reports are everywhere, yet leadership teams continue to ask the same question: “So what should we do?”

    This gap exists because data, analytics, and visual analytics are often treated as interchangeable terms when, in reality, they play very different roles in decision-making. At VisualizExpert, our data analytics services are built on the belief that insights only matter when they lead to confident action.

    Understanding the difference between these three layers is the foundation for building business intelligence systems that don’t just inform — but guide.


    Data: The Raw Material (Not the Deliverable)

    Data is the foundation of everything — but on its own, it has no direction. Tables, logs, metrics, and event streams are simply raw inputs. They answer what happened, but not why or what to do next.

    Many organizations make a critical mistake here: they treat access to data as success. But data without structure, context, and intent increases cognitive load and slows decisions. This is why modern business intelligence consulting focuses less on collecting data and more on shaping it for outcomes.

    At VisualizExpert, we often remind clients: a data source is not a solution. Until data is modeled, validated, and aligned to business goals, it cannot support real decisions.


    Analytics: Making Sense of the Noise

    Analytics is where data begins to create value. Through calculations, aggregations, comparisons, and statistical methods, analytics transforms raw data into insights.

    This is where trends emerge, anomalies are detected, and performance is measured. Solutions like Power BI Dashboard Development and custom analytics solutions allow organizations to move beyond static tables into meaningful analysis.

    However, analytics still has a limitation:
     It explains what is happening — but often stops short of influencing what should happen next.

    Many analytics initiatives fail not because the analysis is wrong, but because the insights are not communicated in a way that decision-makers can quickly understand and trust.


    Visual Analytics: Where Insight Becomes Action

    Visual analytics is the convergence of strategy, data, design, and engineering. It doesn’t just show insights — it shapes how humans perceive, interpret, and act on them.

    This is where data visualization services and interactive business dashboards become critical. Visual analytics reduces time to insight, increases accuracy, and dramatically improves adoption across teams.

    At VisualizExpert, visual analytics means:

    • Designing dashboards around decisions, not metrics
    • Using visual hierarchy to guide attention
    • Embedding business logic directly into reports
    • Enabling users to ask “the next question” without friction

    This is the difference between looking at data and using data.


    Why BI Projects Fail Without Visual Analytics

    Many BI initiatives technically succeed — but practically fail. Why? Because they stop at analytics.

    A dashboard packed with charts but lacking narrative, prioritization, or context creates confusion instead of clarity. This is why BI dashboard solutions must be designed for how executives actually think and decide.

    Without visual analytics:

    • Insights are ignored
    • Dashboards become shelfware
    • Adoption drops
    • ROI disappears

    This is where executive analytics dashboards and decision-ready data visualization change the game — by aligning insights with real-world decisions.


    How VisualizExpert Bridges the Gap

    VisualizExpert operates at the intersection of analytics and decision intelligence. Our approach combines technical depth with business strategy to deliver Power BI consulting services that scale across teams and industries.

    What Makes Our Approach Different

    • Strategy-first design: Every dashboard starts with a decision framework
    • Strong data foundations: Including Power BI data modeling services and optimized schemas
    • Performance-focused engineering: Ensuring speed, reliability, and scalability
    • Human-centered visualization: Dashboards designed for clarity, not decoration

    This is why clients trust us for analytics and reporting consulting that delivers measurable outcomes — not just reports.


    From Static Reports to Living Systems

    Traditional reports answer yesterday’s questions. Visual analytics systems evolve with the business.

    Using tools like Power BI Embedded Analytics and interactive KPI dashboards, we help organizations:

    • Monitor performance in real time
    • Identify risks before they escalate
    • Align teams around shared metrics
    • Build trust in data across leadership

    The result is not just better reporting — but better decision-making at every level.


    The Role of Engineering in Visual Analytics

    Behind every great dashboard is invisible engineering. Poor performance, broken filters, and inconsistent metrics destroy trust instantly.

    That’s why VisualizExpert invests heavily in:

    • Power BI DirectQuery Performance Optimization
    • Secure access using Power BI Row Level Security
    • Scalable architectures through Power BI Managed Services

    Visual analytics only works when the underlying systems are reliable, fast, and governed.


    Beyond BI: Building a Decision Culture

    The future of analytics isn’t more AI or more dashboards — it’s better decisions. Organizations that win are those that treat analytics as a capability, not a project.

    Through Visual Analytics Consulting, VisualizExpert helps teams:

    • Define decision ownership
    • Align metrics with strategy
    • Reduce analysis paralysis
    • Build confidence in insights

    This cultural shift is what turns analytics investments into long-term competitive advantage.

    Power BI Dashboard Development That Drives Decisions

    (Keyword used: Power BI Dashboard Development)

    A well-built Power BI dashboard should not ask users to interpret data — it should guide them. At VisualizExpert, our Power BI dashboards are structured around business questions, not visuals.

    We focus on:

    • Clear KPI hierarchies
    • Scenario-based views
    • Contextual benchmarks
    • Executive-level summaries

    This ensures dashboards are used daily — not reviewed once a month.


    Why Visual Analytics Is the Real Competitive Advantage

    Data is everywhere. Analytics is expected. Visual analytics is rare — and that’s why it matters.

    Organizations that master visual analytics:

    • Decide faster
    • Align teams better
    • Adapt more quickly to change
    • Trust their data

    This is the real ROI of modern BI.


    Final Thoughts: Data Is Potential. Visual Analytics Is Power.

    Data without analytics is noise.
     Analytics without visualization is friction.
     Visual analytics without a strategy is decoration.

    At VisualizExpert, we bring all three together to help organizations move from information to impact — confidently, consistently, and at scale.

    If your dashboards explain the past but don’t guide the future, it’s time to rethink how you use data.

  • Power BI Dashboard Development: Transforming Business Intelligence Into Actionable Insights

    In today’s data-driven world, businesses cannot afford to make decisions based on gut instinct alone. Organizations collect massive amounts of information every day — from sales transactions to customer interactions — but without the right tools, this data remains underutilized. This is where Power BI Dashboard Development comes in. By designing interactive, dynamic, and visually appealing dashboards, companies can convert complex datasets into actionable insights that drive smarter decision-making.

    Effective dashboards do more than just display data; they provide clarity, context, and understanding. With the right Power BI Dashboard Development approach, organizations can monitor key performance indicators (KPIs), track operational efficiency, and identify emerging trends before competitors do. For businesses looking to maximize ROI from their data, investing in structured dashboard development is no longer optional — it’s essential.


    Why Power BI Dashboard Development Matters

    Power BI Dashboard Development bridges the gap between raw data and business intelligence. Modern businesses operate in fast-paced environments where timely insights can make or break a strategy. A well-developed Power BI dashboard allows decision-makers to:

    1. Visualize Data in Real Time: See updated metrics instantly and respond to changes proactively.
    2. Monitor KPIs Across Departments: From finance to marketing, dashboards provide unified insights.
    3. Streamline Reporting Processes: Automated reports reduce manual work and eliminate errors.
    4. Enable Self-Service Analytics: Business users can explore data without needing IT support.

    For example, a logistics company using Power BI dashboards can monitor delivery times, fuel costs, and driver performance simultaneously. By correlating these metrics, managers can make operational improvements, reduce costs, and improve service quality. This is the tangible value that Power BI Dashboard Development delivers.


    Best Practices for Power BI Dashboard Development

    Creating an effective dashboard goes beyond simply dragging charts onto a canvas. Successful Power BI Dashboard Development requires a strategic approach:

    1. Define Business Objectives

    Before building dashboards, it’s critical to understand the key business questions. Are you tracking sales growth? Monitoring operational efficiency? Or measuring marketing campaign performance? Clear objectives guide the dashboard design, ensuring that every visual tells a meaningful story.

    2. Design for the User

    Dashboards must be intuitive and user-friendly. Use clean layouts, consistent color schemes, and logical groupings. Avoid clutter — every chart, table, and KPI should serve a purpose. Remember, a dashboard is not just a display; it’s a decision-making tool.

    3. Optimize Data Models

    A robust data model ensures fast performance and accurate reporting. Implement Power BI Star Schema Design and clean relationships between tables. Proper modeling reduces errors, improves query performance, and enables scalable dashboard solutions.

    4. Leverage DAX for Advanced Analytics

    Complex calculations can be automated using DAX formulas. From dynamic measures to custom KPIs, DAX ensures your dashboards go beyond visualization and provide actionable insights. Optimization of DAX queries also improves performance for large datasets.

    5. Use Interactivity Wisely

    Interactive filters, slicers, and drill-through capabilities allow users to explore data deeply. Interactive business dashboards foster engagement and enable teams to uncover insights themselves, reducing reliance on static reports.


    Common Use Cases of Power BI Dashboard Development

    Organizations across industries leverage Power BI Dashboard Development to solve diverse challenges:

    Sales & Marketing Dashboards

    Track revenue by region, monitor customer acquisition costs, and evaluate campaign effectiveness. Integration with Google Analytics 4 visualizations and other marketing data sources enhances insights.

    Finance & Operations Dashboards

    Visualize budget performance, cash flow trends, and operational KPIs. Real-time dashboards enable finance leaders to make informed decisions and anticipate potential bottlenecks.

    Healthcare Dashboards

    Hospitals and clinics use dashboards to monitor patient outcomes, resource utilization, and operational efficiency. HIPAA-compliant dashboards ensure sensitive patient data is secure while enabling actionable insights.

    Supply Chain & Logistics Dashboards

    Track shipments, inventory levels, and supplier performance. Real-time monitoring improves responsiveness and reduces delays, enhancing overall supply chain resilience.


    How VisualizExpert Excels in Power BI Dashboard Development

    At VisualizExpert, we specialize in end-to-end Power BI Dashboard Development tailored to your business needs. Our team combines technical expertise with domain knowledge to deliver dashboards that are:

    • Insightful: Every metric and chart is purpose-driven.
    • Interactive: Users can drill down into data and explore scenarios.
    • Scalable: Dashboards grow with your business and data complexity.
    • Integrated: Connect seamlessly with your ERP, CRM, Google Analytics, or other data sources.

    Our approach emphasizes analytics strategy services, ensuring that dashboards align with business goals, enable decision-making, and foster a culture of data-driven insights.


    Future Trends in Power BI Dashboard Development

    As BI evolves, Power BI Dashboard Development is embracing new technologies and design philosophies:

    1. AI-Powered Insights: Integration with AI enables predictive analytics, anomaly detection, and automated recommendations.
    2. Mobile-First Dashboards: Users can access insights on-the-go, ensuring timely decisions from anywhere.
    3. Data Storytelling: Dashboards go beyond numbers, incorporating narratives and interactive visualizations that communicate insights clearly.
    4. Real-Time Data Integration: Streaming data from IoT devices, social media, and operational systems allows instant monitoring and response.
    5. Automation & Workflow Integration: Dashboards trigger alerts, workflows, and actions, making BI operational rather than passive.

    By staying ahead of these trends, businesses can turn Power BI dashboards into strategic assets rather than static reports.


    Conclusion

    Effective Power BI Dashboard Development transforms business intelligence into a competitive advantage. By combining robust data models, optimized DAX calculations, and intuitive design, companies can turn raw data into actionable insights that drive growth and efficiency.

    At VisualizExpert, we partner with organizations to deliver custom dashboards that empower decision-makers, streamline reporting, and foster a culture of data-driven success. Whether it’s enterprise-level reporting, interactive KPI dashboards, or automated analytics solutions, our expertise ensures your data works for you — fast, precise, and insightful.

    Investing in Power BI Dashboard Development isn’t just about visualization — it’s about building a foundation for smarter, faster, and more confident business decisions. With the right dashboards, businesses don’t just react to the market — they shape it.

  • Power BI Migration from Excel: What the 2026 Deprecation Means for Your Business Analytics


    The recent announcement from Microsoft about changes to Excel and CSV imports in Power BI Service is more than a routine product update — it’s a clear signal that organizations must rethink how they build and maintain analytics. With legacy Excel and CSV imports being deprecated in 2026, businesses that still rely on old file-based workflows face stale data, broken refresh cycles, and growing reporting risk.

    This is exactly where a well-planned Power BI Migration from Excel becomes essential — not just as a technical fix, but as a strategic analytics upgrade.

    At VisualizExpert, this shift is seen as an opportunity: a chance for organizations to move from fragile spreadsheets to governed, scalable, and insight-driven BI systems that actually support growth.


    Understanding the Power BI Excel Import Deprecation

    Microsoft has confirmed that reports created using the old Excel and CSV import experience in Power BI Service will no longer refresh after July 31, 2026. Even earlier, by May 31, 2026, users will no longer be able to create new semantic models using that legacy option.

    What does this mean in practical terms?

    • Reports will continue to open, but the data will become outdated
    • Scheduled refresh options will disappear
    • Models can’t be edited or downloaded
    • Business users may continue making decisions based on stale numbers — without realizing it

    This isn’t just an IT inconvenience. It’s a business risk.


    Why Excel-Based Reporting Was Always a Bottleneck

    Excel has long been the starting point for analytics — and that made sense. It’s flexible, familiar, and fast for early-stage reporting. But as organizations scale, Excel introduces serious limitations:

    • Manual data updates and version conflicts
    • No centralized governance or security
    • Poor performance with growing data volumes
    • Limited ability to support real-time or near–real-time insights

    The deprecation simply exposes a truth that’s been there all along: Excel is not a sustainable backbone for enterprise analytics.


    Why Power BI Migration from Excel Is Now Non-Negotiable

    A forced change — or a strategic upgrade?

    Many teams see the 2026 deadline as a forced migration. The smarter approach is to treat it as a chance to modernize analytics architecture.

    A proper Power BI Migration from Excel goes beyond “rebuilding the same report.” It involves:

    • Replacing static files with reliable data sources
    • Designing reusable, scalable semantic models
    • Improving data accuracy, refresh reliability, and performance
    • Aligning reports with real business questions — not spreadsheet layouts

    This is where most DIY migrations fail. Teams recreate Excel logic inside Power BI without redesigning the underlying model — leading to the same problems in a new tool.


    What a Strategic Migration Actually Looks Like

    A structured migration approach focuses on long-term value rather than quick fixes.

    1. Analytics Discovery (Not Just File Conversion)

    Teams must first understand:

    • Which Excel reports are business-critical
    • Who uses them and why
    • What decisions depend on them

    This prevents migrating unused or redundant reports and ensures focus on high-impact analytics.

    2. Data Model Redesign

    Excel files often mix raw data, calculations, and presentation. In Power BI, these layers must be separated:

    • Source systems (databases, APIs, cloud tools)
    • Clean, governed semantic models
    • Optimized measures for performance and clarity

    This step alone typically improves refresh speed and report usability.

    3. Business Logic Validation

    Excel formulas rarely scale well. During migration, business rules are reviewed, validated, and standardized — so finance, sales, and operations all see the same truth.

    4. Performance and Refresh Optimization

    Unlike legacy imports, modern Power BI connectors support:

    • Scheduled refresh
    • Incremental data updates
    • Secure access and governance

    This eliminates manual intervention and reduces reporting delays.


    Business Impact: Beyond Technical Compliance

    Migrating before the deadline isn’t just about avoiding broken dashboards. The real value lies in what businesses gain after migration:

    Better Decision Confidence

    Executives no longer question whether numbers are up to date or “which Excel is correct.”

    Faster Reporting Cycles

    What once took days of manual updates becomes automated and reliable.

    Scalable Analytics

    New departments, new data sources, and new KPIs can be added without rebuilding everything from scratch.

    Stronger Data Governance

    Security, access control, and auditability are built into the platform — not enforced through process discipline alone.


    Common Migration Mistakes to Avoid

    As organizations rush to meet the 2026 deadline, several predictable mistakes appear:

    • Recreating Excel layouts instead of redesigning models
    • Migrating everything instead of prioritizing high-value reports
    • Ignoring performance until users complain
    • Treating migration as an IT task rather than a business initiative

    These shortcuts often result in Power BI dashboards that look modern but behave just like spreadsheets — fragile and hard to trust.


    The Role of Expert Guidance in Migration

    A successful migration sits at the intersection of technology, business context, and analytics strategy. That’s why specialized support matters.

    VisualizExpert supports organizations by:

    • Identifying which legacy reports are at risk
    • Designing future-proof Power BI data models
    • Aligning dashboards with executive decision-making
    • Ensuring adoption across teams — not just deployment

    The goal isn’t simply to replace Excel files, but to create analytics systems that scale with the business.


    Preparing for 2026 — Starting Now

    The worst time to address the deprecation is mid-2026, when reports stop refreshing, and leadership starts asking uncomfortable questions.

    The best time is now — when there’s room to:

    • Audit existing Excel-based reports
    • Define a clear analytics roadmap
    • Migrate in phases without disruption

    Organizations that act early don’t just avoid risk — they gain a competitive analytics advantage.

    Final Thoughts

    Microsoft’s decision to retire the old Excel and CSV import experience is a clear message: modern analytics requires modern foundations. Businesses that continue relying on legacy workflows will face increasing friction, while those that invest in structured BI will move faster and decide smarter.

    A thoughtful Power BI Migration from Excel isn’t just a technical necessity — it’s a strategic upgrade to how your organization understands and uses data.

    If your dashboards still depend on spreadsheets behind the scenes, 2026 isn’t the problem. It’s the deadline.

    For organizations looking to move early and migrate with confidence, VisualizExpert helps turn this transition into a long-term analytics advantage — ensuring reports stay refreshable, scalable, and aligned with real business decisions.

    And deadlines are best met with a plan.

  • Power BI Dashboard Development Enters a New Era with Modern Visual Tooltips


    Power BI Dashboard Development has quietly crossed an important milestone. With the general availability of modern visual tooltips, Power BI reports are no longer just static representations of data — they have become more interactive, intuitive, and decision-oriented. This update, now live across Power BI Desktop, web, mobile, Microsoft Teams, and embedded experiences, fundamentally changes how users explore insights inside dashboards.

    For organizations investing in enterprise analytics, this is more than a UI enhancement. It’s a shift in how dashboards guide behavior, reduce friction, and accelerate understanding. At VisualizExpert, we see modern tooltips as a critical building block for next-generation dashboard experiences — especially when reports must scale across business units, leadership layers, and operational teams.


    Why Modern Visual Tooltips Matter in Power BI

    Traditional tooltips in Power BI served a narrow purpose: showing the value behind a data point. While functional, they often required users to leave the flow of analysis to take action — right-clicking, navigating menus, or moving to other pages to explore further.

    Modern visual tooltips change that interaction model.

    They bring context, action, and continuity directly into the moment of exploration. When users hover over a bar, line, or data point, they are no longer just observing data — they are invited to interact with it.

    This matters because dashboards are not consumed passively. They are used under time pressure, during meetings, and in decision-making moments where every extra click creates friction.


    Power BI Dashboard Development and Interactive Data Exploration

    One of the most impactful additions in modern tooltips is the Actions footer, which allows users to drill down, drill up, or drill through directly from the tooltip.

    What this changes for dashboard users:

    • Exploration becomes intuitive, not instructional
    • Insights unfold naturally without breaking focus
    • Users no longer need training just to navigate reports

    From a Power BI Dashboard Development perspective, this enables a new design philosophy: dashboards that guide users forward, instead of forcing them to search for the next step.

    At VisualizExpert, we design dashboards where tooltips act as micro-navigation layers — helping users move from summary to detail without overwhelming the main canvas.


    Consistent Design Through Theme-Based Tooltip Styling

    Another critical improvement is that modern visual tooltips now inherit styling from the report theme. Fonts, colors, and transparency are automatically aligned, creating a seamless and professional look across all visuals.

    This is especially important for enterprise dashboards where:

    • Brand consistency matters
    • Reports are shared with executives and external stakeholders
    • Multiple authors contribute to the same report ecosystem

    Theme-based styling ensures that tooltips do not become visual outliers. Instead, they reinforce trust by maintaining consistency across the entire dashboard experience.

    VisualizExpert leverages this capability to help organizations standardize dashboard design at scale — reducing manual formatting effort while improving visual quality.


    No Disruption to Existing Reports

    One of the most enterprise-friendly aspects of this update is that existing reports remain unchanged unless authors choose to adopt the new experience.

    • New reports use modern tooltips by default
    • Existing reports can be upgraded selectively using “Reset to default”

    This gives BI teams full control over rollout timing, testing, and governance — without introducing unexpected changes to business-critical dashboards.

    For organizations managing hundreds or thousands of reports, this controlled adoption is essential.


    Designing Tooltips for Decision-Making, Not Decoration

    Modern tooltips should not be treated as decorative add-ons. When used intentionally, they become one of the most powerful interaction layers in a Power BI dashboard.

    At VisualizExpert, our Power BI Dashboard Development approach treats tooltips as:

    • Decision accelerators — showing just enough context to move forward
    • Navigation bridges — connecting summary views to deeper analysis
    • Trust builders — reinforcing clarity and consistency

    We design tooltip content to answer the next logical question a user might have — without cluttering the main visual.


    Enterprise Use Cases Where Modern Tooltips Shine

    Modern visual tooltips unlock value across multiple business scenarios:

    Executive Dashboards

    Executives can drill into performance drivers without leaving high-level views, keeping conversations focused and efficient.

    Operational Reporting

    Teams can move from anomaly detection to root-cause analysis in seconds, directly from the point of interest.

    Embedded Analytics

    When Power BI reports are embedded in applications, tooltips reduce the need for custom navigation logic — simplifying development while improving usability.

    These are the environments where thoughtful Power BI Dashboard Development delivers measurable ROI.


    VisualizExpert’s Approach to Modern Power BI Experiences

    Modern tooltips are most effective when they are part of a broader dashboard strategy. VisualizExpert helps organizations align Power BI features with business outcomes by focusing on:

    • Interaction-first dashboard design
    • Scalable theming and layout standards
    • Clear analytical pathways from overview to action

    We don’t just enable features — we design experiences that make those features meaningful.

    By combining platform knowledge with strong visual analytics principles, we help teams turn Power BI dashboards into tools people actually want to use.


    Analytics Maturity Depends on User Experience

    As BI platforms mature, the differentiator is no longer access to data — it’s how easily people can work with it.

    Modern visual tooltips support:

    • Faster insight discovery
    • Reduced cognitive load
    • More confident decision-making

    These are not cosmetic gains. They directly impact adoption, trust, and the perceived value of analytics investments.


    Final Thoughts: Small Interaction, Big Impact

    Modern visual tooltips may seem like a small enhancement, but they reflect a larger shift in Power BI’s evolution — from reporting to guided analytics.

    For organizations serious about Power BI Dashboard Development, this update is an opportunity to rethink how users interact with data at every touchpoint.

    At VisualizExpert, we believe the best dashboards don’t just show information — they anticipate questions, reduce friction, and support action.

    And sometimes, the most powerful changes happen right where users hover.

  • Enterprise Data Observability at Scale with Tableau Dashboard Design by VisualizExpert


    Introduction: Why Observability Is the New BI Standard

    As organizations scale their analytics platforms, dashboards alone are no longer enough. Enterprises running Tableau Cloud across departments, geographies, and thousands of users now face a deeper challenge: observability. Knowing what dashboards exist is easy. Understanding how they are used, who changed what, why performance degrades, and where governance breaks down is where modern analytics leadership begins.

    At VisualizExpert, we help enterprises move beyond static reporting through Tableau Dashboard Design that is supported by enterprise-grade monitoring, governance, and platform intelligence. With the introduction of Tableau Cloud’s Platform Data API, organizations now have unprecedented visibility into their analytics environment — and the opportunity to turn that visibility into action.


    Tableau Dashboard Design Built for Enterprise Governance

    Great dashboards do more than display metrics. They guide decisions, enforce consistency, and build trust. VisualizExpert approaches Tableau Dashboard Design with governance and observability in mind, ensuring dashboards remain valuable as adoption grows.

    Using event-level telemetry from Tableau Cloud, we help organizations understand:

    • Which dashboards are actively used by leadership
    • Which assets create performance bottlenecks
    • Where permissions and access controls change over time

    This transforms dashboards from visual artifacts into governed business assets.


    API Integration Services That Power Platform Observability

    Observability data is only valuable when it is accessible and actionable. The Platform Data API provides rich event logs, but real impact comes from how that data is integrated. VisualizExpert’s API Integration Services enable enterprises to pull Tableau Cloud activity data into data warehouses, monitoring systems, and analytics platforms of their choice.

    With this approach, teams can monitor:

    • User logins and administrative actions
    • Extract refresh failures, including Bridge execution
    • Content changes across sites and projects

    APIs don’t just move data. They create accountability and transparency at scale.


    Creating a Unified Reporting Data Model for Analytics Operations

    Raw event logs create noise without structure. We at VisualizExpert build a Unified Reporting Data Model that connects Tableau platform data with business systems such as CRM, finance, and marketing platforms.

    This allows leaders to answer high-impact questions like:

    • Which dashboards support revenue-critical decisions?
    • Where is BI adoption slowing down?
    • Which users or groups introduce governance risk?

    By unifying observability data with business context, analytics operations become measurable and optimizable.


    Enterprise Tableau Solutions Designed to Scale

    As Tableau Cloud deployments grow into the thousands of users, traditional admin workflows break down. VisualizExpert delivers enterprise Tableau solutions that embed observability into the analytics lifecycle itself.

    Using Platform Data API insights, we help enterprises:

    • Proactively identify unused or redundant assets
    • Detect abnormal access patterns
    • Maintain compliance across regions and teams

    The result is a Tableau environment that scales without losing control.


    Tableau Data Integration Without Performance Blind Spots

    Modern analytics platforms depend on complex data pipelines. VisualizExpert specializes in Tableau data integration architectures that are observable, auditable, and resilient.

    By tracking refresh activity, query behavior, and data latency, organizations gain confidence that:

    • Data freshness meets business expectations
    • Performance issues are diagnosed early
    • Operational failures are visible, not hidden

    Observability ensures data trust doesn’t degrade as complexity increases.


    Visual Analytics Consulting for Platform-Level Decisions

    Most organizations focus analytics on business performance, but few analyze their analytics platforms themselves. VisualizExpert’s Visual Analytics Consulting practice applies analytics thinking to BI operations.

    By visualizing platform usage, content sprawl, and admin activity, leaders can:

    • Optimize licensing and infrastructure costs
    • Improve self-service adoption
    • Align analytics investments with business value

    This is analytics about analytics — and it changes how platforms are managed.


    Interactive Tableau Dashboards for Admin and Leadership Teams

    Observability data becomes powerful when it is easy to explore. VisualizExpert builds interactive Tableau dashboards specifically for administrators, COEs, and executive stakeholders.

    These dashboards surface:

    • Usage trends across departments
    • High-risk permission changes
    • Performance anomalies over time

    Instead of reacting to incidents, teams gain continuous situational awareness.


    Tableau KPI Dashboards That Measure Analytics Maturity

    Analytics maturity is measurable. Using Platform Data API insights, VisualizExpert designs Tableau KPI dashboards that track platform health indicators such as adoption, performance reliability, and governance coverage.

    These dashboards help organizations:

    • Benchmark analytics maturity over time
    • Identify gaps in governance or training
    • Tie platform improvements to business outcomes

    BI success becomes quantifiable, not subjective.


    Tableau Automation Services for Scalable Administration

    Manual administration does not scale. VisualizExpert provides Tableau automation services that leverage observability data to trigger workflows automatically.

    Examples include:

    • Alerting on failed refreshes or access violations
    • Automated cleanup of unused content
    • Scheduled reporting for audit and compliance teams

    Automation turns observability into operational efficiency.


    Enterprise BI Managed Services with Built-In Observability

    For organizations seeking long-term support, VisualizExpert offers Enterprise BI Managed Services that incorporate monitoring, governance, and optimization as ongoing capabilities.

    By continuously analyzing platform data, we ensure:

    • Performance remains consistent as usage grows
    • Governance adapts to organizational change
    • Analytics platforms deliver sustained business value

    Observability is not a one-time setup — it’s an operating model.


    Why VisualizExpert for Tableau Cloud Observability

    The Tableau Cloud Platform Data API marks a turning point for enterprise analytics management. But APIs alone don’t create insight. Strategy, modeling, integration, and visualization do.

    At VisualizExpert, we combine deep Tableau expertise with modern data engineering and governance practices to help organizations:

    • Understand their analytics platforms at scale
    • Reduce risk and operational friction
    • Enable confident, data-driven decision-making

    Observability is the foundation of trust. And trust is the foundation of analytics that actually works.