Introduction: Why Data Alone Is No Longer Enough
Most organizations today are drowning in data — but still starving for clarity. Spreadsheets, dashboards, and reports are everywhere, yet leadership teams continue to ask the same question: “So what should we do?”
This gap exists because data, analytics, and visual analytics are often treated as interchangeable terms when, in reality, they play very different roles in decision-making. At VisualizExpert, our data analytics services are built on the belief that insights only matter when they lead to confident action.
Understanding the difference between these three layers is the foundation for building business intelligence systems that don’t just inform — but guide.
Data: The Raw Material (Not the Deliverable)
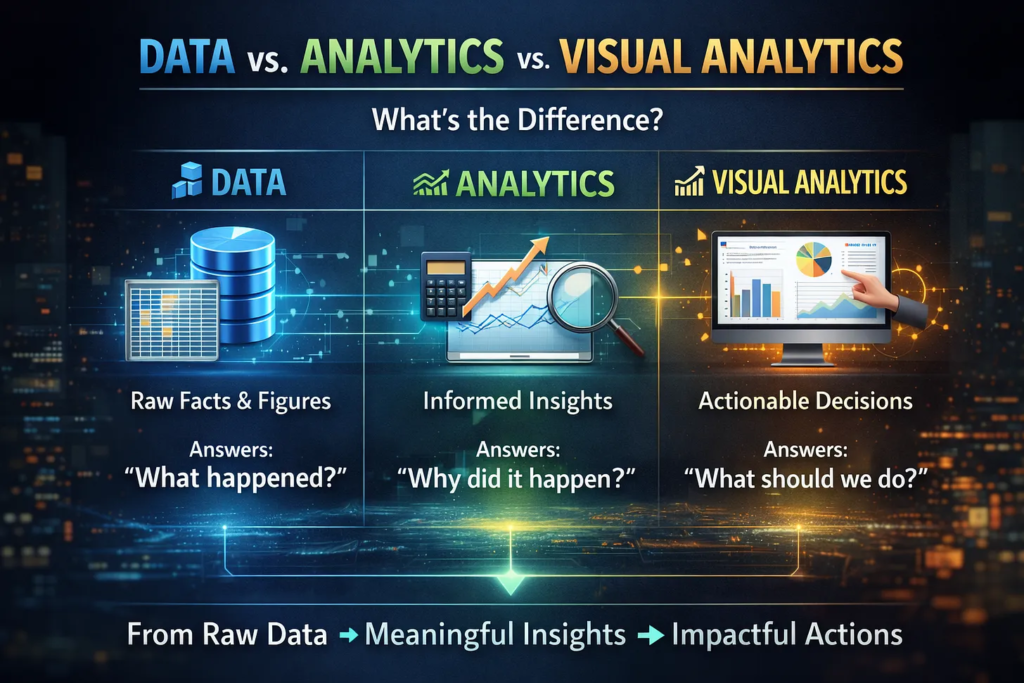
Data is the foundation of everything — but on its own, it has no direction. Tables, logs, metrics, and event streams are simply raw inputs. They answer what happened, but not why or what to do next.
Many organizations make a critical mistake here: they treat access to data as success. But data without structure, context, and intent increases cognitive load and slows decisions. This is why modern business intelligence consulting focuses less on collecting data and more on shaping it for outcomes.
At VisualizExpert, we often remind clients: a data source is not a solution. Until data is modeled, validated, and aligned to business goals, it cannot support real decisions.
Analytics: Making Sense of the Noise
Analytics is where data begins to create value. Through calculations, aggregations, comparisons, and statistical methods, analytics transforms raw data into insights.
This is where trends emerge, anomalies are detected, and performance is measured. Solutions like Power BI Dashboard Development and custom analytics solutions allow organizations to move beyond static tables into meaningful analysis.
However, analytics still has a limitation:
It explains what is happening — but often stops short of influencing what should happen next.
Many analytics initiatives fail not because the analysis is wrong, but because the insights are not communicated in a way that decision-makers can quickly understand and trust.
Visual Analytics: Where Insight Becomes Action
Visual analytics is the convergence of strategy, data, design, and engineering. It doesn’t just show insights — it shapes how humans perceive, interpret, and act on them.
This is where data visualization services and interactive business dashboards become critical. Visual analytics reduces time to insight, increases accuracy, and dramatically improves adoption across teams.
At VisualizExpert, visual analytics means:
- Designing dashboards around decisions, not metrics
- Using visual hierarchy to guide attention
- Embedding business logic directly into reports
- Enabling users to ask “the next question” without friction
This is the difference between looking at data and using data.
Why BI Projects Fail Without Visual Analytics
Many BI initiatives technically succeed — but practically fail. Why? Because they stop at analytics.
A dashboard packed with charts but lacking narrative, prioritization, or context creates confusion instead of clarity. This is why BI dashboard solutions must be designed for how executives actually think and decide.
Without visual analytics:
- Insights are ignored
- Dashboards become shelfware
- Adoption drops
- ROI disappears
This is where executive analytics dashboards and decision-ready data visualization change the game — by aligning insights with real-world decisions.
How VisualizExpert Bridges the Gap
VisualizExpert operates at the intersection of analytics and decision intelligence. Our approach combines technical depth with business strategy to deliver Power BI consulting services that scale across teams and industries.
What Makes Our Approach Different
- Strategy-first design: Every dashboard starts with a decision framework
- Strong data foundations: Including Power BI data modeling services and optimized schemas
- Performance-focused engineering: Ensuring speed, reliability, and scalability
- Human-centered visualization: Dashboards designed for clarity, not decoration
This is why clients trust us for analytics and reporting consulting that delivers measurable outcomes — not just reports.
From Static Reports to Living Systems
Traditional reports answer yesterday’s questions. Visual analytics systems evolve with the business.
Using tools like Power BI Embedded Analytics and interactive KPI dashboards, we help organizations:
- Monitor performance in real time
- Identify risks before they escalate
- Align teams around shared metrics
- Build trust in data across leadership
The result is not just better reporting — but better decision-making at every level.
The Role of Engineering in Visual Analytics
Behind every great dashboard is invisible engineering. Poor performance, broken filters, and inconsistent metrics destroy trust instantly.
That’s why VisualizExpert invests heavily in:
- Power BI DirectQuery Performance Optimization
- Secure access using Power BI Row Level Security
- Scalable architectures through Power BI Managed Services
Visual analytics only works when the underlying systems are reliable, fast, and governed.
Beyond BI: Building a Decision Culture
The future of analytics isn’t more AI or more dashboards — it’s better decisions. Organizations that win are those that treat analytics as a capability, not a project.
Through Visual Analytics Consulting, VisualizExpert helps teams:
- Define decision ownership
- Align metrics with strategy
- Reduce analysis paralysis
- Build confidence in insights
This cultural shift is what turns analytics investments into long-term competitive advantage.
Power BI Dashboard Development That Drives Decisions
(Keyword used: Power BI Dashboard Development)
A well-built Power BI dashboard should not ask users to interpret data — it should guide them. At VisualizExpert, our Power BI dashboards are structured around business questions, not visuals.
We focus on:
- Clear KPI hierarchies
- Scenario-based views
- Contextual benchmarks
- Executive-level summaries
This ensures dashboards are used daily — not reviewed once a month.
Why Visual Analytics Is the Real Competitive Advantage
Data is everywhere. Analytics is expected. Visual analytics is rare — and that’s why it matters.
Organizations that master visual analytics:
- Decide faster
- Align teams better
- Adapt more quickly to change
- Trust their data
This is the real ROI of modern BI.
Final Thoughts: Data Is Potential. Visual Analytics Is Power.
Data without analytics is noise.
Analytics without visualization is friction.
Visual analytics without a strategy is decoration.
At VisualizExpert, we bring all three together to help organizations move from information to impact — confidently, consistently, and at scale.
If your dashboards explain the past but don’t guide the future, it’s time to rethink how you use data.
Leave a Reply