Author: Supriya karmakar

  • How API Integration Services Enable Data Visualization in Power BI Dashboards

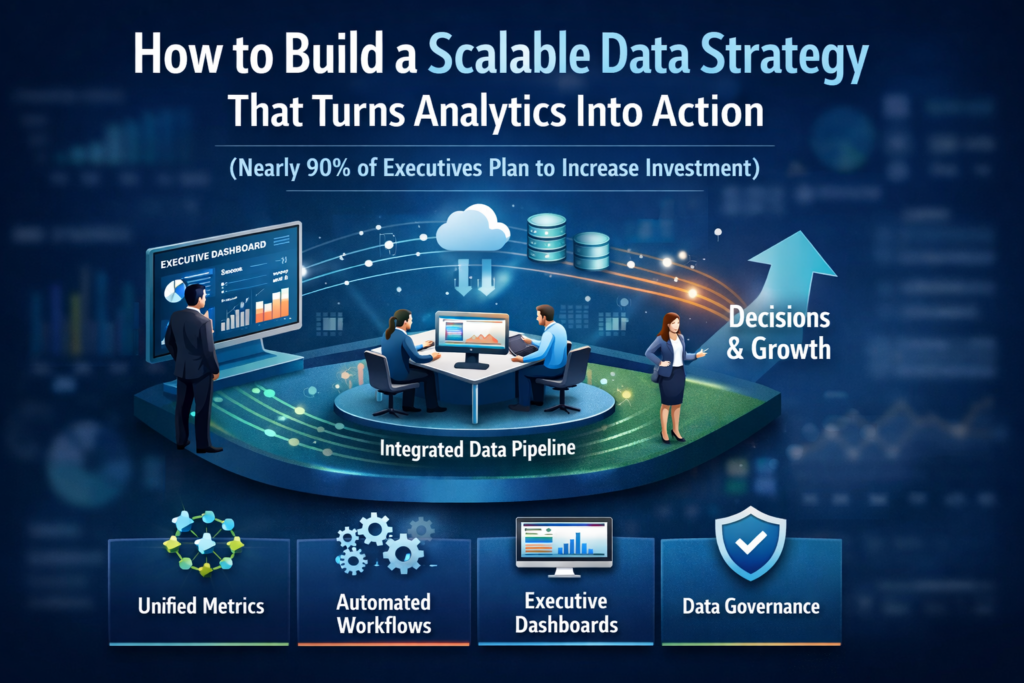
    Modern businesses don’t struggle with a lack of data—they struggle with fragmented data. Sales lives in one system, marketing in another, finance somewhere else, and operations in spreadsheets no one fully trusts. This is where API Integration Services become the foundation of scalable analytics.

    At VisualizExpert, we see a recurring pattern: organizations invest in Power BI dashboards, but insights remain delayed or incomplete because the data pipeline feeding those dashboards is brittle or manual. APIs solve this problem by enabling systems to communicate continuously, creating a live data backbone that fuels meaningful analytics.

    This article explains how APIs enable Power BI visualization, what it takes to build them correctly, and why this approach delivers far more than faster reports.


    Why APIs Matter More Than Ever in Business Analytics

    APIs act as standardized messengers between systems. Instead of exporting files, scheduling uploads, or relying on human intervention, APIs allow platforms to exchange data automatically and securely.

    For analytics teams, this unlocks something critical: trust. When dashboards update reliably and consistently, leaders stop questioning numbers and start acting on them. This is the hidden value behind effective data analytics services—not charts, but confidence.

    As businesses scale, APIs become the only sustainable way to support advanced analytics and reporting consulting without operational drag.


    APIs as the Foundation of Power BI Dashboard Development

    A Power BI dashboard is only as good as the data model behind it. APIs allow Power BI to pull data directly from CRMs, ERPs, marketing platforms, and operational tools, eliminating manual syncs.

    When implemented correctly, APIs support:

    • Near real-time refresh cycles
    • Consistent schema definitions
    • Scalable data ingestion

    This is essential for Power BI Dashboard Development that supports daily decision-making instead of retrospective reporting.


    Defining the Objective Before Building an API

    Every effective API starts with a business question. Is the goal performance monitoring? Forecasting? Executive reporting?

    At VisualizExpert, we align API design with business intelligence consulting principles. That means defining:

    • What decisions the dashboard should enable
    • Which metrics matter most
    • How frequently data must update

    Without this clarity, APIs often become technical assets without business impact.


    Structuring APIs for Enterprise Data Visualization

    Once the objective is clear, API structure matters. Poorly structured endpoints lead to bloated models, slow dashboards, and confused users.

    Well-designed APIs support:

    • Clean fact and dimension separation
    • Scalable Power BI data modeling
    • Efficient refresh performance

    This foundation enables reliable enterprise data visualization, especially as datasets grow in size and complexity.


    Authentication, Security, and Governance

    Security is not optional. APIs must protect sensitive business data while remaining usable for analytics teams.

    Modern implementations rely on token-based authentication, role-based access, and controlled permissions. These practices align closely with Power BI integration services, ensuring only authorized data flows into dashboards.

    Strong governance builds executive trust and supports long-term analytics adoption.


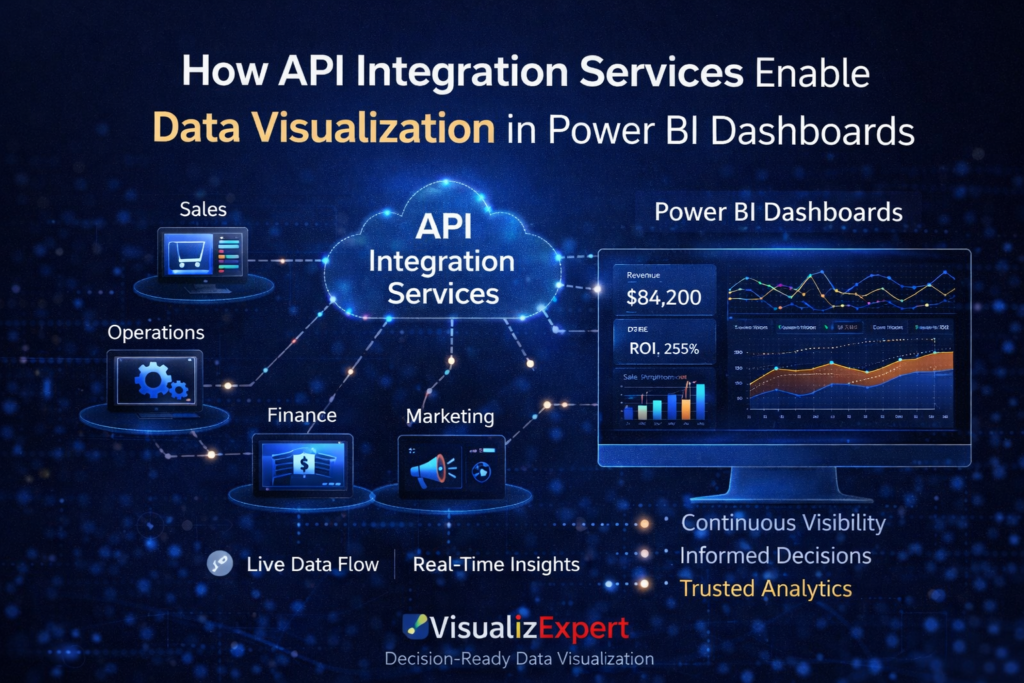
    From Raw Data to Interactive Business Dashboards

    Once APIs are live, their true value appears in how data is visualized. APIs allow Power BI to surface metrics across departments in one unified view.

    This enables:

    • Cross-functional KPIs
    • Live operational monitoring
    • Consistent definitions across teams

    The result is interactive business dashboards that replace static reports and fragmented tools.


    APIs and KPI Dashboard Services

    Manual KPI tracking breaks down as businesses scale. APIs automate metric calculation and delivery, ensuring dashboards reflect reality—not outdated snapshots.

    This is why APIs are central to modern KPI dashboard services. They allow metrics to update automatically, align across teams, and support accountability at every level.


    Supporting Executive Analytics Dashboards

    Executives don’t want raw data—they want clarity. APIs enable Power BI dashboards that aggregate performance across systems without delay.

    With the right API architecture, executive analytics dashboards answer questions instantly:

    • Are we growing profitably?
    • Where are risks emerging?
    • Which channels deserve more investment?

    This is where APIs directly influence strategic outcomes.


    Why API-Driven Dashboards Outperform File-Based Reporting

    File-based reporting introduces delays, errors, and version conflicts. APIs remove these risks by creating a continuous data flow.

    This shift supports decision-ready data visualization, where insights are available when decisions are made—not weeks later.


    Power BI Managed Services and API Operations

    APIs require monitoring, maintenance, and optimization. Without ownership, integrations degrade over time.

    Through Power BI Managed Services, VisualizExpert ensures APIs remain reliable, scalable, and aligned with evolving business needs. This includes performance tuning, schema updates, and integration reviews.


    APIs Enable Advanced Power BI Reporting Solutions

    When APIs power dashboards, teams can move beyond basic charts to advanced analytics:

    • Trend detection
    • Anomaly monitoring
    • Cross-platform comparisons

    This elevates dashboards into full Power BI reporting solutions that support both tactical and strategic use cases.


    The Role of Data Visualization Services

    APIs deliver data—but visualization delivers understanding. Strong data visualization services ensure API-fed dashboards communicate insight clearly, without clutter or confusion.

    This balance between engineering and design defines analytics maturity.


    APIs as Part of a Strategic BI Roadmap

    API integration is not a one-off project. It’s a core pillar of Strategic BI Roadmap Development.

    Organizations that treat APIs as long-term assets achieve:

    • Faster analytics delivery
    • Lower operational costs
    • Higher analytics adoption

    This approach ensures dashboards evolve alongside the business.


    From Data Access to Data Driven Decision Making

    Ultimately, APIs exist to support better decisions. When systems talk seamlessly, leaders act confidently.

    This is how API-driven dashboards enable true Data Driven Decision Making—not by adding more data, but by removing friction.


    Why Founders and Leaders Should Care

    For founders, speed matters. APIs eliminate delays between activity and insight, allowing rapid course correction.

    For leaders, accuracy matters. APIs reduce manual errors and inconsistencies, strengthening trust in analytics.

    Both benefit from dashboards that are always current and reliable.


    VisualizExpert’s Approach to API-Powered Analytics

    At VisualizExpert, we design APIs with outcomes in mind. Our work blends engineering discipline with analytics strategy, ensuring dashboards support real decisions.

    As a specialized Data Analytics Agency, we help organizations connect systems, design scalable integrations, and transform raw data into insight leaders trust.


    Final Thoughts

    APIs are not just technical connectors—they are the nervous system of modern analytics. When designed intentionally, they turn Power BI dashboards into living tools for action.

    If your dashboards rely on delayed extracts or manual updates, the limitation isn’t Power BI—it’s the pipeline behind it.

    With the right API strategy, visibility becomes continuous, decisions become faster, and analytics finally delivers on its promise.

    At VisualizExpert, we help businesses build that foundation—so insights move at the speed of the business, not the reporting cycle.

  • Mirrored Line Chart vs 100% Stacked Area Chart in Looker Studio: A Decision-Ready Data Visualization Perspective


    Choosing the wrong chart rarely breaks a dashboard visually — but it often breaks decision-making. In Looker Studio dashboards, mirrored line charts and 100% stacked area charts are frequently used to show changing proportions over time. Both appear logical. Both are popular. Yet only one consistently supports decision-ready data visualization when the goal is clarity, speed, and trust.

    At VisualizExpert, we see this pattern across analytics engagements: leaders don’t question the data, but they hesitate on conclusions because visuals subtly introduce doubt. Understanding how chart structure shapes interpretation is essential for founders, executives, and analytics teams who rely on Looker Studio for strategic insight.

    This article explores when mirrored line charts help, where they fail, and why 100% stacked area charts often produce better business outcomes.


    Why Chart Choice Matters More Than Most Teams Realize

    Modern dashboards are packed with advanced features — parameters, sliders, calculated fields, and interactivity. But sophistication doesn’t guarantee understanding. The human brain processes visual signals faster than numbers, which means charts don’t just show data — they frame reality.

    This is why data visualization for decision making must prioritize perception over decoration. When a chart forces the viewer to mentally validate logic before interpreting insight, cognitive load increases. Decisions slow down. Confidence erodes.

    That tradeoff sits at the heart of the mirrored line vs stacked area debate.


    Mirrored Line Charts: Familiar, Expressive, and Risky

    Mirrored line charts show two complementary values — often shares that add up to 100% — reflected across a central axis. They are commonly used in media, trend storytelling, and public-facing analytics.

    The appeal is understandable:

    • Lines naturally represent time
    • Crossovers feel meaningful
    • Directional movement is easy to spot

    For storytelling, mirrored line charts can be effective. They highlight contrast, tension, and narrative flow. This is why they persist in marketing reports, public research, and trend analysis.

    However, in interactive business dashboards, mirrored lines introduce a subtle problem: redundancy.

    Because one line is mathematically derived from the other, experienced viewers instinctively question the transformation before trusting the message. The chart demands validation before insight — an unnecessary tax in executive contexts.


    The Hidden Cognitive Cost of Mirrored Views

    For data-literate users, mirrored charts often trigger a pause:
     “Is this truly mirrored?”
     “Are both series independent?”
     “What’s the actual baseline?”

    That pause matters.

    In leadership environments, hesitation equals friction. When dashboards are used in meetings, reviews, or performance discussions, visuals must be immediately interpretable. Any chart that redirects attention away from the insight toward its construction weakens impact.

    This is why mirrored line charts frequently underperform in executive analytics dashboards, even when the data itself is sound.


    100% Stacked Area Charts: Clarity Through Structure

    By contrast, 100% stacked area charts encode the same information using proportion and area rather than reflection. A single dividing line shows the relationship between components over time, grounded against a stable baseline.

    This structure offers three key advantages:

    1. The total is always explicit
    2. Proportions are visually intuitive
    3. Redundancy is eliminated

    Instead of asking “Is this mirrored?”, viewers immediately see how shares evolve. The chart answers the business question without requiring explanation, making it ideal for Looker Studio reports designed for decision-making.


    When 100% Stacked Area Charts Perform Better

    Stacked area charts excel when:

    • You’re tracking distribution changes over time
    • Shares must always equal a whole
    • The audience includes executives or founders
    • The chart appears in recurring reviews

    In these contexts, clarity beats convention. The area format reduces interpretation effort and supports faster insight, aligning with Business-Aligned Metrics Framework principles.

    This doesn’t make mirrored charts “wrong” — but it makes them situational.


    Adding Interactivity Without Sacrificing Understanding

    One strength of Looker Studio is the ability to let users switch views using parameters and controls. Done well, this enhances exploration. Done poorly, it adds confusion.

    At VisualizExpert, we often recommend a default 100% stacked area chart, with an optional toggle for a mirrored view. This respects advanced users without forcing validation overhead on everyone else.

    This pattern supports Interactive Dashboard Design while preserving interpretability.


    Design Choices That Separate Insight From Noise

    Beyond chart type, design discipline matters:

    • Clear color logic
    • Stable baselines
    • Minimal annotations
    • Consistent scales

    Over-styling undermines trust. Business dashboards should not require narration. This philosophy underpins our data visualization services and is especially critical in Looker Studio, where flexibility can easily lead to excess.


    Why This Matters for Founders and Executives

    Founders don’t open dashboards to admire charts. They open them to decide:

    • Should we invest more?
    • Are we gaining or losing share?
    • Is momentum real or temporary?

    Charts that slow interpretation delay action. This is why visualization choices directly affect business outcomes, especially in growth, marketing, and product analytics.

    Clear visuals support Data Driven Decision Making. Ambiguous ones quietly undermine it.


    Looker Studio Consulting With Intentional Visualization

    Effective Looker Studio consulting starts by defining the decision, not the chart. Only after the question is clear should visualization options be considered.

    Whether working with marketing data, operational metrics, or leadership reporting, VisualizExpert applies a decision-first lens. This ensures visuals reduce cognitive load rather than add to it.


    Strategic Context: Visualization as Part of the BI Roadmap

    Chart selection is not a design detail — it’s a governance decision. As organizations scale analytics, consistency matters.

    Within Strategic BI Roadmap Development, we treat visualization standards as part of platform maturity. This prevents dashboard sprawl, misinterpretation, and trust erosion over time.


    Final Thoughts: Convention Should Never Override Clarity

    Mirrored line charts have their place. They tell stories, show contrast, and feel familiar. But familiarity is not the same as effectiveness.

    When the goal is decision speed, trust, and adoption, 100% stacked area charts often provide a clearer, more honest view of change.

    In Looker Studio, the best dashboards don’t impress — they inform.

    If your charts require explanation, the design — not the data — needs attention. At VisualizExpert, we help teams replace visual ambiguity with confidence, ensuring analytics supports decisions instead of distracting from them.

    Because in business, clarity is not a nice-to-have — it’s the competitive edge.

  • How to Build an AI-Ready Analytics Strategy for 2026

    In 2026, expectations for AI and analytics are rising faster than tolerance for wasted effort. Organizations are no longer impressed by modern dashboards, AI pilots, or advanced platforms unless those investments translate into real decisions and measurable outcomes. This is why Strategic BI Roadmap Development has become a critical leadership capability — not a documentation exercise.

    At VisualizExpert, we see a clear pattern across industries: data initiatives fail not because of missing tools, but because teams invest without a clear sequence, shared meaning, or adoption strategy. As AI accelerates delivery timelines, the cost of misalignment only grows. What leaders get right in 2026 will come down to focus — where to invest, what to standardize, what to operationalize, and what to stop building altogether.


    Why Adoption Is the Defining Challenge of 2026

    Across analytics, BI, AI, and data platforms, one theme consistently separates success from failure: organizational adoption.

    Dashboards that go unused, metrics that spark debate instead of decisions, and AI outputs that no one trusts are symptoms of the same root problem — analytics disconnected from how the business actually operates.

    Modern BI environments now include:

    • Self-service analytics
    • AI-assisted querying
    • Real-time dashboards
    • Embedded analytics in business workflows

    Yet adoption still breaks down when users don’t trust the numbers or understand how insights connect to decisions. VisualizExpert helps organizations address this gap by aligning analytics delivery with business intent — before tools, platforms, or automation.


    Strategic BI Roadmap Development: The Foundation for AI-Ready Analytics

    A BI roadmap in 2026 must do more than list initiatives. It must act as a decision framework that aligns analytics, AI, engineering, and governance around shared outcomes.

    A strong roadmap:

    • Anchors analytics investments to business priorities
    • Sequences foundational work before automation and AI
    • Makes trade-offs explicit when priorities compete
    • Aligns stakeholders on what “success” actually means

    Without this structure, AI accelerates confusion instead of clarity.

    This is where Strategic BI Roadmap Development becomes essential — ensuring analytics maturity grows in a way the organization can trust, govern, and adopt.


    Priority 1: Standardize Meaning Before Scaling Analytics and AI

    The fastest way to kill analytics adoption is inconsistent definitions.

    Revenue, margin, customer, conversion, and performance metrics often mean different things across departments. When leaders see conflicting numbers, trust erodes — and dashboards are abandoned.

    AI does not solve this problem. It amplifies it.

    AI-powered analytics can surface insights faster, but they rely entirely on the logic beneath them. Without standardized KPIs and governed semantic layers, AI accelerates disagreement rather than alignment.

    VisualizExpert helps organizations:

    • Identify KPI inconsistencies across teams
    • Consolidate logic into shared data models
    • Design executive and operational dashboards that reflect one version of truth

    Standardized meaning is the prerequisite for scalable analytics, self-service BI, and AI-driven insights.


    Priority 2: Treat Governance as a Control Layer, Not Documentation

    In 2026, governance is no longer about policies sitting in folders. It is the mechanism that makes analytics and AI explainable, controllable, and trustworthy.

    As AI systems influence decisions, leaders must be able to answer:

    • Where did this data come from?
    • What does this metric actually represent?
    • Who owns this logic?
    • Where is AI allowed to act — and where is it not?

    Governance must be operationalized directly into dashboards, data models, and reporting workflows. VisualizExpert embeds governance into BI environments through:

    • Unified reporting data models
    • Controlled access via row-level security
    • Clear metric ownership and documentation
    • Executive-ready dashboards designed for accountability

    Governance is not a brake on innovation. It is what allows analytics and AI to scale safely.


    Priority 3: Get Data Engineering Fundamentals Right Before AI

    AI raises the bar for data quality and discipline.

    Poor data is easy to spot in a dashboard. It is far harder to detect once it feeds AI systems. Errors compound silently, degrading trust and outcomes over time.

    Before scaling AI, organizations must get the fundamentals right:

    • Reliable data ingestion
    • Clean, well-modeled data
    • Atomic-level traceability
    • Scalable, governed pipelines

    VisualizExpert’s work across Power BI, Tableau, Looker Studio, and cloud data platforms reinforces a simple truth: proven modeling approaches and clean architecture are not outdated — they are what make AI usable.

    AI accelerates what already exists. It does not fix weak foundations.


    Priority 4: Align Data Teams to Business Decisions, Not Outputs

    In 2026, analytics teams will not be judged by how much they deliver — but by how effectively they influence decisions.

    Many organizations still measure success by:

    • Number of dashboards built
    • Speed of delivery
    • Volume of reports

    These metrics say nothing about impact.

    High-performing organizations align data work to:

    • Specific business decisions
    • Clear success metrics
    • Operational workflows

    VisualizExpert helps bridge the gap between insight and action by designing dashboards that are:

    • Decision-oriented, not exploratory by default
    • Embedded into leadership and operational reviews
    • Aligned with business KPIs and performance management

    When analytics is built around decisions, adoption becomes a natural outcome.


    Priority 5: Build Only What the Organization Can Govern and Adopt

    More technology does not equal more value.

    In 2026, successful organizations will resist overbuilding platforms they cannot govern, maintain, or explain. Novelty fades quickly when adoption stalls.

    Modern BI and analytics environments must be:

    • Governable at scale
    • Understandable to business users
    • Flexible enough to evolve without chaos

    VisualizExpert advises clients to prioritize readiness over novelty — building platforms and dashboards designed for long-term adoption, not short-term experimentation.


    Priority 6: Make AI Useful Through Iterative, Bounded Execution

    Most organizations use AI to summarize, explain, or recommend. Real ROI comes when AI helps teams do the work — within clear guardrails.

    Leaders must:

    • Start with targeted, low-risk use cases
    • Define where AI can act and where it cannot
    • Ensure auditability and recovery paths
    • Iterate quickly based on real usage

    AI value compounds through iteration, not grand launches. VisualizExpert supports this approach by integrating analytics, automation, and reporting into existing workflows — rather than creating isolated AI experiences.


    Priority 7: Strengthen Delivery Discipline as AI Speeds Everything Up

    AI compresses timelines, but it does not eliminate the need for planning.

    Faster delivery increases the risk of misalignment if goals are unclear. Many analytics initiatives fail quietly — delivered on time, but never adopted.

    Strong delivery discipline ensures:

    • Every initiative ties back to a business problem
    • Success is defined before work begins
    • Adoption is measured, not assumed

    VisualizExpert emphasizes repeatable delivery frameworks that keep analytics grounded in outcomes, even as AI accelerates execution.


    What This Means for Data Leaders in 2026

    The organizations that succeed in 2026 will:

    • Standardize meaning before automation
    • Treat governance as an operational layer
    • Invest in strong data foundation
    • Align analytics to decisions, not outputs
    • Build platforms designed for adoption
    • Use AI iteratively and responsibly
    • Reinforce delivery discipline

    At the center of all of this is clarity — and that clarity comes from a well-defined BI roadmap.


    Why VisualizExpert

    VisualizExpert helps organizations move from fragmented analytics to decision-ready BI through:

    • Business-aligned dashboard design
    • Executive and operational analytics
    • Power BI, Tableau, and Looker Studio expertise
    • KPI strategy and data modeling
    • Analytics adoption and roadmap consulting

    We don’t just build dashboards. We help organizations make analytics stick.

    Ready to Build an Analytics Strategy That Actually Gets Adopted?

    If your organization is investing in AI and analytics but struggling with trust, adoption, or ROI, it’s time to rethink the roadmap.

    VisualizExpert helps data leaders design BI strategies that align people, platforms, and decisions — so analytics delivers value in 2026 and beyond. 

  • How to Build a Scalable Data Strategy That Turns Analytics Into Action


    How to Build a Scalable Data Strategy That Turns Analytics Into Action

    Introduction: Why Most Data Strategies Still Fail to Drive Action

    Organizations are investing heavily in data, dashboards, and analytics platforms. Yet many leadership teams still struggle to turn insights into consistent decisions. Reports exist. Dashboards look impressive. But adoption remains uneven, and business impact is often unclear.

    This gap exists because scalability is not about tools alone. A scalable data strategy connects people, metrics, and technology in a way that grows with the business. At VisualizExpert, we work with teams across industries to design analytics strategy services that go beyond reporting and enable confident, repeatable decision-making.

    This guide outlines a practical framework for building a data strategy that scales, adapts, and actually gets used.


    Start With Business Decisions, Not Dashboards

    The most common mistake organizations make is starting with visualizations instead of decisions. A scalable data strategy begins by identifying the questions leaders must answer regularly.

    Examples include:

    • How efficiently are we acquiring customers?
    • Which channels are driving profitable growth?
    • Where are operational bottlenecks emerging?

    By grounding analytics in decision workflows, companies avoid vanity metrics and focus on business-aligned metrics frameworks that matter across teams. This approach ensures dashboards evolve with strategy, not the other way around.

    At VisualizExpert, we often begin engagements with KPI strategy consulting to define success metrics before selecting tools or building reports.


    Design a Unified Reporting Data Model Early

    Scalability breaks down quickly when every team defines metrics differently. Marketing, sales, and finance may all report “revenue” or “users” differently, eroding trust.

    A unified reporting data model creates a shared foundation:

    • Common definitions for core KPIs
    • Consistent date logic and attribution rules
    • Centralized transformations for reuse

    This model becomes the backbone for Power BI data modeling, Tableau dashboard services, and Looker Studio marketing reports, ensuring insights remain consistent as usage grows.


    Choose Platforms Based on Use Cases, Not Trends

    No single BI tool solves every problem. A scalable strategy acknowledges that different teams have different needs.

    • Power BI dashboards are ideal for operational reporting, finance, and executive scorecards
    • Tableau visual analytics excels in exploratory analysis and storytelling
    • GA4 analytics dashboards and Looker Studio support agile marketing and performance tracking

    The key is integration, not standardization at all costs. VisualizExpert helps organizations design BI dashboard solutions that allow tools to coexist while maintaining governance and consistency.


    Build Executive Trust With Decision-Ready Dashboards

    Executives do not want more charts. They want clarity.

    Scalable analytics focuses on:

    • Executive analytics dashboards with clear context
    • Fewer metrics, stronger narratives
    • Consistent refresh cycles and definitions

    An executive summary dashboard should answer “What changed?” and “What should we do next?” in seconds. This is where data storytelling services play a critical role, transforming analytics into leadership conversations rather than technical reviews.


    Automate Data Pipelines to Reduce Manual Risk

    Manual data preparation does not scale. As volume and complexity increase, so does the risk of errors and delays.

    Modern strategies rely on:

    • Automated data pipeline engineering
    • Reliable ETL and ELT consulting
    • API-based ingestion for marketing, CRM, and finance data

    Automation ensures analytics teams spend less time fixing data and more time improving insights. It also supports real-time data dashboards where speed matters.


    Optimize Performance as Data Grows

    As dashboards expand, performance issues often emerge. Slow reports quickly undermine trust and adoption.

    Scalable strategies include:

    • Efficient data models
    • Aggregation strategies
    • Optimization for Power BI DirectQuery performance

    Whether using embedded analytics or enterprise deployments, performance planning must be proactive, not reactive.


    Govern Access Without Blocking Adoption

    Security and accessibility must scale together. Too little governance creates risk; too much creates friction.

    Effective strategies implement:

    • Power BI Row Level Security for controlled access
    • Role-based permissions aligned with job functions
    • Clear ownership of metrics and dashboards

    This balance supports enterprise needs while still enabling interactive business dashboards across teams.


    Align Analytics With Growth and Change

    A scalable data strategy anticipates change:

    • New markets
    • New channels
    • New products

    That means designing dashboards and models that adapt without constant rework. VisualizExpert focuses on analytics and reporting consulting that supports long-term evolution, not one-off projects.


    Measure Adoption, Not Just Accuracy

    Perfect data that no one uses delivers zero value.

    Organizations should track:

    • Dashboard usage trends
    • Decision latency improvements
    • Reduction in ad-hoc reporting requests

    These signals indicate whether analytics is becoming part of daily operations. Adoption metrics are as important as data quality metrics.


    Build Internal Capability Alongside Technology

    Tools do not create data-driven cultures. People do.

    Scalable strategies invest in:

    • Analytics training and support
    • Clear documentation
    • Shared data language across teams

    This ensures analytics remains sustainable as teams grow and roles change.


    Summary: Turning Investment Into Impact

    With nearly 90% of executives increasing analytics investment, the differentiator is no longer access to data, but how effectively it is used.

    A scalable data strategy:

    • Anchors analytics to decisions
    • Standardizes metrics without stifling flexibility
    • Automates pipelines and optimizes performance
    • Builds trust through clarity, not complexity

    At VisualizExpert, we design data analytics services that help organizations move from reports to results. Our focus is not just on building dashboards, but on enabling confident, repeatable, decision-making at scale.

    If your analytics investment isn’t delivering action, it’s time to rethink the strategy behind it.

    👉 Talk to a VisualizExpert analytics consultant and build a data strategy that scales with your business.

  • Monitor Tableau Cloud Deployments of Any Size with the Platform Data API for Enterprise Tableau Solutions

    In modern analytics environments, visibility is everything. As organizations scale their Tableau Cloud usage from a handful of users to thousands across regions and business units, governance and performance can quickly become challenging. At VisualizExpert, we help organizations design enterprise Tableau solutions that remain secure, performant, and business-aligned even as adoption accelerates. The introduction of the Tableau Cloud Platform Data API marks a pivotal shift in how administrators and analytics leaders can monitor, govern, and optimize Tableau deployments at scale.

    This article explores why observability matters, what the Platform Data API enables, and how organizations can turn raw platform telemetry into strategic insight and operational control.

    The reality of scaling Tableau Cloud deployments

    Tableau has always excelled at democratizing analytics. Teams can publish dashboards quickly, connect to diverse data sources, and empower business users with self-service insights. But success brings complexity.

    As Tableau Cloud adoption grows, administrators begin to face familiar pain points:

    • Rapid growth in workbooks, data sources, and extracts
    • Increasingly complex permission models across sites and groups
    • Performance variability due to extract schedules, query patterns, and usage spikes
    • Compliance and audit requirements that demand traceability
    • Limited time and tooling to manually monitor platform activity

    In small deployments, these issues are manageable through built-in admin views and hands-on support. At enterprise scale, however, manual approaches break down. What’s needed is continuous, data-driven observability.

    Why observability is critical for modern analytics platforms

    Observability goes beyond basic monitoring. It answers not only what is broken, but what is happening, why it is happening, and what should be done next.

    For Tableau Cloud administrators, true observability supports three foundational responsibilities:

    1. Security and compliance
      Detect unusual access patterns, permission changes, or administrative actions that could indicate risk or non-compliance.
    2. Operational reliability and performance
      Monitor extract refresh behavior, background tasks, and usage trends to proactively address failures or bottlenecks.
    3. Business value optimization
      Understand which dashboards are actually used, which content is stale, and where investment in analytics delivers real impact.

    Historically, gaining this level of insight required stitching together partial data sources or relying on external tools with limited coverage. The Platform Data API changes that equation.

    What the Tableau Cloud Platform Data API delivers

    The Platform Data API introduces a centralized, pull-based mechanism to access event log data across an entire Tableau Cloud deployment. Instead of relying on isolated views or vendor-specific push integrations, organizations can retrieve detailed, structured event data and analyze it in the tools of their choice.

    Key capabilities include:

    • Comprehensive event coverage
      Track logins, administrative actions, permission changes, content updates, and extract refresh activity, including Bridge-managed refreshes.
    • Unified, deployment-wide visibility
      Access data across sites and environments through consistent API endpoints.
    • Platform-agnostic integration
      Pull data into data warehouses, SIEM platforms, or custom analytics pipelines without being locked into a specific ecosystem.
    • Scalable retention and freshness
      Near real-time data and extended retention windows are available for organizations with advanced monitoring and resiliency needs.

    For the first time, Tableau Cloud customers of all editions can access the same foundational observability data, leveling the playing field for governance and operational excellence.

    Turning raw events into actionable intelligence

    While the Platform Data API provides the data, value is realized only when that data is transformed into insight. This is where analytics architecture and visualization expertise matter.

    Organizations commonly use Platform Data API outputs to:

    • Build security and audit dashboards highlighting sensitive actions
    • Analyze usage trends by department, geography, or role
    • Identify underutilized or redundant dashboards
    • Monitor extract reliability and refresh performance
    • Feed alerts and automation workflows for proactive issue resolution

    By integrating platform telemetry with business context, analytics leaders can move from reactive firefighting to strategic platform stewardship.

    Enterprise Tableau solutions powered by platform observability

    How enterprise Tableau solutions benefit from the Platform Data API

    For large organizations, the Platform Data API is more than a technical enhancement. It becomes a cornerstone of scalable analytics governance.

    Well-designed enterprise Tableau solutions use this data to establish:

    • Standardized governance frameworks
      Clear policies for content lifecycle management, access control, and certification, backed by measurable data.
    • Performance accountability
      Objective metrics for refresh reliability, dashboard response times, and system usage patterns.
    • Data-driven enablement
      Insights that inform training, content optimization, and adoption strategies based on real user behavior.
    • Automation and resilience
      Event-driven workflows that reduce manual admin effort and improve platform uptime.

    At VisualizExpert, we see the Platform Data API as an accelerator for mature analytics operating models, enabling organizations to manage Tableau Cloud as a strategic enterprise platform rather than a collection of dashboards.

    What’s next: the future of Tableau Cloud observability

    The Platform Data API is the foundation for a broader observability roadmap.

    Two upcoming advancements are particularly impactful:

    • Entity snapshots
      Event data explains what happened, but snapshots reveal the current state. With snapshots of users, workbooks, data sources, and groups, organizations can answer questions about inactivity, ownership gaps, and content sprawl.
    • Accelerated admin insights
      By re-architecting admin analytics on top of this new data pipeline, Tableau is paving the way for faster refresh cycles and more timely operational insights

    Together, these capabilities point toward a future where analytics platforms are managed with the same rigor and transparency as core enterprise systems.

    How VisualizExpert helps organizations get value faster

    Access to observability data is only the first step. Many teams struggle with designing the right metrics, building scalable data models, and presenting insights that drive action.

    VisualizExpert supports organizations by:

    • Designing analytics-ready schemas for platform telemetry
    • Building executive-ready dashboards for governance and performance monitoring
    • Aligning Tableau platform metrics with business and risk objectives
    • Enabling automation and alerting based on event patterns
    • Establishing long-term analytics governance frameworks

    Our approach blends deep platform expertise with business-focused analytics design, ensuring that observability translates into measurable outcomes.

    Conclusion: from visibility to control

    As Tableau Cloud deployments grow, the cost of poor visibility increases. Without observability, platforms drift toward inefficiency, risk, and declining trust. The Tableau Cloud Platform Data API represents a major step forward in giving organizations the insight they need to lead their analytics environments with confidence.

    By combining this new level of platform telemetry with thoughtful analytics design and governance, organizations can unlock the full potential of Tableau at scale. With the right strategy, tools, and partners, observability becomes not just a monitoring function, but a driver of sustained analytics value.

    If you are managing a growing Tableau Cloud environment and need visibility, control, and governance at scale,
     VisualizExpert can help you turn platform data into actionable insights.
     👉 Talk to a Tableau Consulting Expert

  • How to Fix Data Discrepancies in GA4 Looker Studio Dashboards


    Introduction: Why GA4 and Looker Studio Rarely Match Perfectly

    If you’ve ever built GA4 Looker Studio dashboards, you’ve likely faced the uncomfortable moment when numbers don’t align with what stakeholders see in Google Analytics 4. While exact matches across analytics tools aren’t always achievable, understanding why discrepancies occur — and how to manage them — helps set realistic expectations and build trust.

    At VisualizExpert, we frequently work with marketing teams, analysts, and executives who rely on dashboards for decision-making. This guide explains the most common causes of GA4 and Looker Studio data differences and provides practical solutions you can confidently share with clients and internal teams.


    Verify Data Before Building Dashboards

    Before opening Looker Studio, always validate critical metrics directly in GA4. This simple step prevents wasted effort and avoids painful rework after a dashboard is already live.

    User-based metrics are especially sensitive to discrepancies. Validating them upfront helps ensure your GA4 Looker Studio dashboards are grounded in accurate expectations rather than assumed parity.

    Best practice:
     Document baseline GA4 numbers (date range, filters, and attribution settings) before building any visualizations.


    Metrics Most Prone to Discrepancies

    Not all metrics behave the same across tools. The following are the most common sources of variance:

    User-Related Metrics

    • Active users (1-day, 7-day, 28-day)
    • Stickiness metrics (DAU/WAU, DAU/MAU, WAU/MAU)

    These metrics rely on probabilistic models and identity resolution, making them more volatile — especially on high-traffic properties.

    Session and View Metrics

    Session counts, page views, and event totals generally align more closely, but minor differences can still occur due to processing delays or filters.

    Understanding which metrics are “estimate-heavy” helps explain why GA4 Looker Studio dashboards may never perfectly mirror the GA4 UI.


    GA4 Data Source in Looker Studio: Standard Reports vs Explorations

    GA4 Looker Studio Dashboards and Data Origins

    A common misconception is that Looker Studio pulls data from GA4 Explorations. In reality, the GA4 connector uses standard GA4 reports, including custom dimensions and metrics.

    This distinction matters because:

    • Explorations use different aggregation logic
    • Processing times vary
    • User de-duplication behaves differently

    When presenting GA4 Looker Studio dashboards, it’s essential to clarify this to stakeholders. Doing so reduces confusion when numbers differ between Explorations and dashboards.


    Looker Studio Sampling: Why It Happens and How to Manage It

    Sampling exists to improve performance on large datasets. GA4 applies sampling under certain conditions, and Looker Studio inherits that sampling automatically.

    Unlike GA4, Looker Studio does not display a sampling warning. This often leads teams to assume something is “wrong” with their dashboards.

    Key Things to Remember

    • Sampling only happens once (no double sampling)
    • The sampling rate is controlled by GA4
    • Looker Studio simply reflects the API output

    How to Reduce Sampling Impact

    • Avoid including “today” in reports
    • Use consistent date ranges across tools
    • Break large queries into smaller time windows

    These steps improve confidence in GA4 Looker Studio dashboards, even when sampling is unavoidable.


    Understanding Estimation and Calculation Methods in GA4

    GA4 uses advanced estimation techniques such as HyperLogLog++ (HLL++) to count users efficiently. This approach dramatically improves performance but introduces small margins of error.

    Metrics like:

    • Active users
    • Sessions

    are approximations, not raw counts.

    Because GA4 Looker Studio dashboards connect through the GA4 Data API, they inherit these estimates. Small discrepancies are expected — and normal.


    Avoiding Misleading Metrics in Data Blending

    Data blending is one of the most common sources of inflated or misleading metrics in Looker Studio.

    When blending GA4 data with external sources:

    • Users may be double-counted
    • Aggregations can behave unexpectedly
    • Filters may not apply evenly

    Recommended Approach

    Instead of blending:

    • Keep GA4 as a primary data source
    • Add contextual data (annotations, notes) separately
    • Sync date ranges using controls

    At VisualizExpert, we often advise performing joins outside Looker Studio and then importing clean datasets to maintain trustworthy GA4 Looker Studio dashboards.


    GA4 Exploration Data Downloads: Why Numbers Change

    When you download GA4 Exploration data and upload it into Looker Studio, you may notice totals no longer match the GA4 interface.

    This happens because:

    • GA4 Explorations show modeled totals
    • Downloaded data reflects row-level values
    • Looker Studio aggregates raw rows using SUM logic

    As a result, dashboards match the downloaded file — not the Exploration UI.

    This distinction is critical when building historical GA4 Looker Studio dashboards for reporting or audits.


    GA4 Exploration Data and Aggregation in Looker Studio

    Here’s a real-world scenario we often see:

    • GA4 Exploration shows: 15,602 users
    • Looker Studio shows: 20,251 users
    • Manual SUM() in Sheets: 20,251 users

    The dashboard is correct — but it’s correct based on the downloaded structure, not GA4’s modeled view.

    Understanding this nuance helps avoid false alarm discussions around GA4 Looker Studio dashboards.


    Why GA4 Exploration Data Changes Over Time

    GA4 data is not static. Even if you don’t modify a report, numbers may change days later due to:

    • Delayed event processing
    • Modeled key events updated post-hoc
    • Backend GA4 recalculations

    When aggregated externally, even small GA4 adjustments can compound into visible changes in GA4 Looker Studio dashboards.


    How to Explain Discrepancies to Clients and Executives

    Clear communication is just as important as technical accuracy.

    What to Say

    • GA4 uses estimation models
    • Looker Studio reflects API outputs
    • Small variances are expected and acceptable
    • Trends matter more than absolute precision

    This framing reinforces trust and positions dashboards as decision-support tools, not forensic accounting systems.


    Summary: Building Trustworthy GA4 Looker Studio Dashboards

    Data discrepancies between GA4 and Looker Studio are not bugs — they’re a byproduct of modern analytics systems designed for scale and speed.

    By understanding:

    • Sampling behavior
    • Estimation logic
    • Aggregation differences
    • Data blending risks

    you can confidently build GA4 Looker Studio dashboards that stakeholders trust and use.

    At VisualizExpert, we specialize in designing dashboards that balance accuracy, performance, and clarity — so decision-makers focus on insights, not inconsistencies.

    Stop guessing why your GA4 and Looker Studio data don’t match.
     Get expert guidance, proven frameworks, and decision-ready dashboards built by analytics specialists.
     👉 Talk to a GA4 & Looker Studio Expert

  • How Biggest Movers Charts Make Power BI Dashboards Decision-Ready

    Introduction: Why Static Metrics No Longer Work

    Power BI dashboards are no longer just reporting tools—they are decision systems. Yet many dashboards still fail at the most critical job: helping leaders instantly understand what changed, why it changed, and where to act next.

    Most reports focus on totals, averages, or rankings. While useful, these metrics hide the real story—movement. A product can still be a top seller while rapidly declining. A region can look average while quietly becoming the fastest-growing market.

    This is where Biggest Movers charts change everything. Instead of asking users to compare periods manually, these visuals surface the largest positive and negative changes automatically—turning dashboards into early-warning systems and opportunity detectors.

    In this article, we explain how Biggest Movers charts elevate Power BI dashboards, how they work conceptually, and why they are essential for modern analytics teams.


    What Is a Biggest Movers Chart?

    A Biggest Movers chart highlights dimension members (products, regions, customers, campaigns) with the largest absolute change between two time periods.

    Unlike traditional “Top N” visuals, it answers different questions:

    • What improved the most?
    • What declined the fastest?
    • Where should we investigate immediately?

    By showing both gains and losses in one visual, Biggest Movers charts reduce cognitive load and eliminate the need for multiple charts.


    Why Most Power BI Dashboards Miss Performance Shifts

    Many dashboards rely on static comparisons:

    • Current month vs previous month tables
    • Rank-based bar charts
    • KPI cards with arrows

    The problem? These formats require mental math. Users must scan, compare, and interpret before acting.

    In high-pressure environments—sales reviews, operations calls, executive meetings—this friction kills insight velocity. Leaders don’t need more numbers; they need direction.

    Biggest Movers charts remove ambiguity by surfacing movement first, context second.


    How Biggest Movers Strengthen Power BI Dashboards

    1. Immediate Pattern Recognition

    Movement is easier to process than raw values. When users see bars extending left (decline) and right (growth), the story is instantly clear—no legend or explanation required.

    This makes Power BI dashboards usable even for non-technical stakeholders.

    2. Balanced View of Performance

    Traditional dashboards often over-celebrate growth while hiding decline. Biggest Movers force balance by displaying both extremes in a single view.

    This prevents false confidence and promotes healthier performance discussions.

    3. Faster Root-Cause Analysis

    By identifying where change occurred, analysts can drill down faster into why it happened—saving hours of investigation time.


    Designing Biggest Movers Charts That Actually Work

    Choose the Right Metric

    Biggest Movers charts are most effective for metrics that indicate momentum, such as:

    • Revenue change
    • Volume growth
    • Conversion rate shift
    • Cost increase or decrease

    Avoid vanity metrics that don’t drive decisions.

    Use Absolute Change, Not Percent Alone

    Percent change can exaggerate small numbers. Absolute change provides clarity, especially in executive-level Power BI dashboards.

    Percent change can still be layered in tooltips for context.

    Limit the Number of Movers

    Showing too many items defeats the purpose. Focus on:

    • Top 5 increases
    • Top 5 decreases

    This keeps attention on what matters most right now.


    Conditional Formatting: Turning Insight into Action

    Color is not decoration—it’s guidance.

    Effective Biggest Movers charts use:

    • Neutral colors for baseline
    • Strong contrast for growth vs decline
    • Consistent color logic across the dashboard

    This ensures users don’t have to relearn meaning every time they open the report.

    In high-stakes Power BI dashboards, consistency equals trust.


    Biggest Movers for Different Business Teams

    Sales Teams

    • Identify accounts at risk before churn
    • Spot fast-growing products or regions
    • Prioritize pipeline follow-ups

    Marketing Teams

    • Track campaign performance swings
    • Identify channels gaining or losing efficiency
    • Adjust spend in near real time

    Operations Teams

    • Monitor cost spikes
    • Detect supply chain disruptions early
    • Track productivity changes across units

    This flexibility makes Biggest Movers charts one of the most reusable visuals in Power BI.


    Common Mistakes to Avoid

    Even well-intended dashboards fail when:

    • Too many dimensions are shown at once
    • Time periods are unclear
    • Users can’t filter context easily
    • Visuals lack explanations or annotations

    The goal of Power BI dashboards is not to impress—it’s to enable confident decisions.


    Making Biggest Movers Executive-Friendly

    Executives don’t want to explore—they want answers.

    To make Biggest Movers work at leadership level:

    • Add short insight labels (e.g., “Driven by pricing change”)
    • Use clean, uncluttered layouts
    • Pair with one supporting KPI card for context

    This transforms dashboards from reporting tools into decision briefings.


    Why VisualizExpert Builds Dashboards Around Movement

    At VisualizExpert, we design Power BI dashboards around behavior, not just data.

    That means:

    • Prioritizing change over static totals
    • Designing visuals for speed, not density
    • Ensuring every chart answers a business question

    Biggest Movers charts align perfectly with this philosophy because they reduce noise and highlight action.


    Final Thoughts: Movement Is the Story

    In modern analytics, change is more valuable than status. The fastest-moving businesses win not because they have more data, but because they see shifts earlier and respond faster.

    By integrating Biggest Movers charts into Power BI dashboards, organizations move from passive reporting to proactive decision-making.

    If your dashboards still require explanation, they’re not working hard enough.

    Stop reporting numbers. Start revealing movement.
    Let our experts at VisualizExpert redesign your Power BI dashboards to surface what actually changes—and why it matters.

    👉 Talk to a Power BI Dashboard Expert
    🔗 https://visualizexpert.com/

  • Why Most Reporting Fails Without Real-Time Data Dashboards (And How Looker Studio Fixes It)

    Dashboards are meant to simplify decision-making—but for many organizations, reporting still feels slow, fragmented, and frustrating. Static reports, delayed updates, and disconnected tools often prevent teams from acting when it matters most. This is where real-time data dashboards change everything.

    Without real-time visibility, even accurate data loses value. Leaders make decisions based on yesterday’s numbers, teams wait on manual updates, and insights arrive too late to influence outcomes. At VisualizExpert, we see this pattern repeatedly: businesses don’t suffer from a lack of data—they suffer from a lack of timely, usable insight.

    In this article, we explore why traditional reporting fails, how user experience plays a critical role, and how Looker Studio enables real-time dashboards that actually support decisions instead of slowing them down.


    The Hidden Problem With Traditional Reporting

    Most reporting systems were not designed for speed or usability. They evolved from spreadsheets, exports, and slide decks—formats built for review, not action.

    Here’s what typically goes wrong:

    • Reports are updated weekly or monthly, not continuously
    • Data lives across multiple tools with no unified view
    • Users rely on analysts for every new question
    • Dashboards show too many metrics without context
    • Stakeholders don’t trust or understand the numbers

    The result is predictable: dashboards get ignored. Teams fall back on instinct, assumptions, or outdated summaries. Reporting becomes a task instead of a strategic asset.


    Why Timing Matters More Than Volume

    Organizations often believe they need more data to make better decisions. In reality, they need faster access to the right data.

    Delayed insights cause:

    • Missed optimization opportunities
    • Slow responses to performance drops
    • Reactive instead of proactive decisions
    • Endless back-and-forth between teams

    A report that arrives late—even if it’s accurate—fails its purpose. Decision-making happens in the present, not in hindsight.

    This is exactly why real-time data dashboards have become essential for modern teams.


    How Real-Time Data Dashboards Change Decision-Making

    Real-time dashboards shift reporting from a passive activity to an active decision system.

    Instead of asking:

    “What happened last month?”

    Teams can ask:

    “What’s happening right now—and what should we do next?”

    What Real-Time Dashboards Enable

    • Immediate visibility into performance changes
    • Faster validation of strategy and experiments
    • Continuous monitoring instead of periodic reviews
    • Shared context across teams and stakeholders

    When dashboards update automatically, decisions become grounded in reality—not assumptions.


    The UX Problem Most Dashboards Ignore

    Speed alone isn’t enough. A dashboard can be real-time and still fail if users don’t understand it.

    This is where dashboard UX becomes critical.

    Poor UX leads to:

    • Cognitive overload
    • Misinterpretation of metrics
    • Confusion instead of clarity
    • Loss of trust in the data

    Well-designed dashboards prioritize:

    • Clear hierarchy
    • Focused KPIs
    • Logical layout
    • Minimal but meaningful visuals

    At VisualizExpert, we design dashboards with one core principle:
    If a user can’t understand it in seconds, it won’t be used.


    Designing Dashboards Around Users, Not Tools

    Dashboards are not built for databases—they’re built for people.

    Effective dashboard UX starts by asking:

    • Who is this for?
    • What decisions will they make?
    • What actions should this dashboard support?

    Executives need clarity and direction.
    Marketing teams need performance signals.
    Operations teams need early warnings.

    A single dashboard trying to serve everyone usually serves no one.

    User-centered design ensures:

    • Each audience sees only what matters
    • Metrics are aligned with real decisions
    • Complexity is hidden behind simplicity

    Why Looker Studio Solves the Real Reporting Problem

    Looker Studio is not just a visualization tool—it’s a decision-enablement platform when implemented correctly.

    What makes Looker Studio effective:

    • Live connections to multiple data sources
    • Automatic refresh without manual intervention
    • Interactive filters for self-serve analysis
    • Cloud-based sharing with access control
    • Flexible design for different user roles

    When combined with thoughtful UX and data modeling, Looker Studio transforms reporting from static snapshots into living systems.


    Where Most Looker Studio Dashboards Still Go Wrong

    Despite its capabilities, many Looker Studio dashboards fail because they replicate old reporting habits.

    Common mistakes include:

    • Recreating Excel reports instead of rethinking insights
    • Showing every metric “just in case”
    • Ignoring performance and load times
    • Designing for aesthetics over usability
    • Failing to define a single source of truth

    Technology doesn’t fix reporting problems—design and strategy do.


    What High-Impact Dashboards Do Differently

    High-performing dashboards share a few critical traits:

    • They answer specific business questions
    • They highlight trends, not raw numbers
    • They guide attention, not distract it
    • They are trusted and consistently used

    Most importantly, they are decision-first, not data-first.

    At VisualizExpert, our approach focuses on aligning data, UX, and business intent—so dashboards support real decisions, not just reporting requirements.


    Building Trust Through Consistency and Clarity

    Trust is the foundation of dashboard adoption.

    Users trust dashboards when:

    • Numbers match across teams
    • Definitions are consistent
    • Data refreshes reliably
    • Visuals are easy to interpret

    Once trust is lost, dashboards become decoration.

    Real-time dashboards reinforce trust by:

    • Eliminating manual errors
    • Reducing lag between action and insight
    • Providing a shared, current view of reality

    From Reporting to Decision Systems

    The future of analytics is not more reports—it’s decision-ready dashboards.

    Organizations that succeed with analytics:

    • Reduce reporting effort
    • Increase insight accessibility
    • Empower non-technical users
    • Act faster with confidence

    This shift requires more than tools. It requires the right design mindset, governance, and implementation strategy.


    Final Thoughts

    Most reporting fails not because data is wrong—but because it arrives too late, feels overwhelming, or lacks clarity.

    Real-time data dashboards solve this by delivering timely, accessible, and trustworthy insights that support real decisions.

    When designed with users in mind and implemented thoughtfully using Looker Studio, dashboards stop being passive reports—and start becoming strategic assets.

    At VisualizExpert, we believe dashboards should do one thing exceptionally well:
    help people make better decisions, faster.

  • Strategic BI Roadmap Development: How VisualizExpert Turns Data Strategy into Organization-Wide Adoption

    Strategic BI Roadmap Development is the difference between having a data strategy on paper and seeing it actively used across your organization. In the first 90 days of most analytics initiatives, leaders face the same challenge: dashboards are built, tools are purchased, yet decision-making remains unchanged. At VisualizExpert, we help organizations close this gap by translating strategy into an execution-ready roadmap that aligns business priorities, analytics delivery, and measurable ROI.

    A well-designed roadmap does more than list projects. It clarifies what will be delivered, when it will be delivered, and why it matters to revenue, efficiency, and risk reduction. Most importantly, it creates trust — among executives who fund initiatives and departments that depend on analytics to run their operations.

    This article explains how VisualizExpert approaches Strategic BI Roadmap Development to drive adoption, accountability, and sustained business impact.


    What Is a Strategic BI Roadmap — and Why Most Fail Without One

    A BI roadmap is a sequenced operating plan that connects business goals to analytics execution. Without it, organizations often experience:

    • Disconnected Power BI dashboards
    • Conflicting KPIs across departments
    • Low adoption of reporting solutions
    • Analytics teams overwhelmed by ad-hoc requests

    Strategic BI Roadmap Development solves these issues by aligning KPI strategy consultingbusiness intelligence consulting, and decision-ready data visualization into a single, shared plan.

    At VisualizExpert, we design roadmaps that answer four executive-level questions clearly:

    1. What business outcomes will analytics drive?
    2. Which dashboards, reports, and models deliver those outcomes?
    3. When will value be realized?
    4. What resources and skills are required to execute?

    Strategic BI Roadmap Development as an Executive Decision Framework

    Executives don’t fund dashboards — they fund outcomes. This is why Strategic BI Roadmap Development must function as a decision framework, not a technical document.

    VisualizExpert structures roadmaps to support funding and prioritization by:

    • Tying initiatives to board-level KPIs
    • Quantifying ROI through efficiency gains and revenue impact
    • Sequencing initiatives based on feasibility and readiness
    • Showing trade-offs when new requests arise

    Instead of debating isolated requests for Power BI reporting solutions, leaders evaluate initiatives in context — understanding what moves forward, what moves out, and why.

    This approach ensures analytics investments stay aligned with business priorities, even as strategies evolve.


    Building Department-Level Adoption Through Clear Deliverables

    Analytics adoption happens in the middle of the organization. Department leaders need clarity, not architecture diagrams.

    VisualizExpert designs BI roadmaps that act as shared timelines across teams by clearly defining:

    • Executive analytics dashboards for leadership visibility
    • Interactive business dashboards for operations and sales
    • Power BI KPI tracking aligned to departmental goals

    Each deliverable includes timing, ownership, and business purpose — ensuring stakeholders know exactly what they will receive and when.

    By grounding analytics delivery in real operational needs, departments stop viewing BI as an IT project and start treating it as a performance tool.


    Designing Analytics That Are Actually Used

    Adoption depends on usability. Even the most accurate data fails if decision-makers don’t trust or understand it.

    VisualizExpert prioritizes interactive dashboard design and data storytelling services to ensure insights are intuitive, credible, and actionable. This includes:

    • Clear metric definitions and context
    • Consistent KPI logic across reports
    • Visual design optimized for executive consumption
    • Shareable stakeholder reports that reduce manual presentations

    When analytics answers real business questions quickly, usage becomes habitual — not mandated.


    Aligning Power BI Architecture With Roadmap Execution

    A roadmap only works if the underlying data model supports scale. VisualizExpert integrates Power BI Data Modeling Services and Power BI Star Schema Design directly into roadmap planning.

    This ensures that:

    • KPIs remain consistent as reporting expands
    • Performance scales with adoption
    • New dashboards don’t introduce conflicting metrics

    We also address performance early using Power BI DirectQuery Performance optimization where real-time access is required, avoiding costly rework later.

    The result is a scalable analytics foundation that grows with the business — not against it.


    Factoring People and Skills Into the BI Roadmap

    One of the most common reasons BI initiatives stall is unrealistic capacity planning. Strategic BI Roadmap Development must treat people as core investments, not afterthoughts.

    VisualizExpert explicitly maps:

    • Required roles and skill sets
    • Internal vs external delivery responsibilities
    • Ongoing maintenance and support needs

    Our clients often pair roadmap execution with Power BI Managed Services to ensure continuity, reduce burnout, and maintain momentum after initial delivery.

    By making resourcing visible, leadership can make informed decisions — rather than discovering gaps mid-project.


    Quarterly Roadmap Reviews That Prove Impact

    A BI roadmap is not a one-time artifact. It must evolve with the business.

    VisualizExpert embeds quarterly reviews into every roadmap, focusing on:

    • Business impact achieved (not just dashboards delivered)
    • Adoption and usage metrics
    • Re-prioritization based on new initiatives
    • Data readiness and operational gaps

    These reviews reinforce accountability and keep analytics aligned with changing objectives — a critical factor in long-term BI adoption services.


    Why Organizations Choose VisualizExpert for BI Roadmap Execution

    VisualizExpert operates as a data analytics agency focused on outcomes, not tool implementation alone. Our roadmap engagements combine:

    • Analytics strategy services
    • Power BI dashboard development
    • Executive summary dashboards
    • ROI-driven reporting solutions

    Clients choose VisualizExpert because we bridge the gap between strategy, design, and execution — ensuring analytics becomes embedded in how decisions are made.


    Key Takeaways

    • Strategic BI Roadmap Development turns analytics vision into an executable operating plan.
    • Adoption increases when roadmaps clearly define deliverables, timing, and business value.
    • Executives need ROI-focused decision frameworks, not technical documentation.
    • Departments adopt BI when dashboards align with real performance goals.
    • Staffing, data modeling, and design must be planned together — not separately.
    • Quarterly reviews keep BI aligned, credible, and impactful.

    Turn Your Data Strategy Into Measurable Results
    Talk to a VisualizExpert consultant and build a BI roadmap your teams actually adopt—aligned to ROI, KPIs, and executive decision-making.
    👉 Schedule a Free Strategy Call

  • How Visual Intelligence Is Powering Confident Decisions in the Agentic Era

     For more than a decade, every major technology shift in analytics has sparked the same claim: dashboards are dead. Machine learning was supposed to replace them. Automation was supposed to run decisions end to end. Now generative AI and autonomous agents are said to make visual analytics obsolete.

    Yet inside organizations that carry real accountability—revenue targets, operational risk, compliance, and people decisions—the opposite is happening. As systems become faster and more automated, leaders are asking for more clarity, not less. What’s changing is not the relevance of dashboards, but their purpose. Static reporting is fading. Data visualization for decision making is becoming the human governance layer of the AI-driven enterprise.

    Dashboards are no longer destinations you visit after the fact. They are decision systems that sit between data, AI, and action.


    From Reports to the Decision Layer

    Traditional BI was built for hindsight. Reports explained what happened last quarter, last month, or yesterday. In the agentic era, that model breaks down. AI systems generate predictions and recommendations in seconds, but accountability still sits with humans. No executive approves a strategic shift, a budget reallocation, or an autonomous action without understanding why.

    This is where the role of a modern Business Intelligence Consultant has fundamentally changed. The job is no longer to produce dashboards. It is to design a decision environment where AI outputs, business logic, and human judgment converge. Analytics now acts as the connective tissue that translates machine reasoning into something leaders can verify and trust.

    Without this layer, organizations don’t innovate—they automate confusion.


    Why Trust Is the Real Bottleneck

    Most enterprises don’t lack data or tools. They lack alignment. Metrics live across dashboards, spreadsheets, notebooks, copilots, and embedded systems. Definitions vary by department. Numbers don’t match. When trust erodes, decision-making slows.

    This is why executive analytics dashboards remain central to leadership behavior. Executives don’t use dashboards because they like charts. They use them because dashboards provide a shared reality—a single place to confirm data, logic, risk, and action before committing to outcomes.

    Visual intelligence solves the last-mile trust problem by making insight verifiable, explainable, and shared. In an AI-powered environment, that trust layer becomes more important, not less.


    Letting Bad Dashboards Die

    Not all dashboards deserve to survive. The ones that should disappear are the static, handcrafted reports disconnected from a governed source of truth. These dashboards are slow, manual, and dangerous in a world where decisions happen in real time.

    Modern BI dashboard solutions are dynamic and decision-driven. They are designed around the actions leaders need to take, not the data analysts want to show. If a dashboard doesn’t reduce cognitive effort or lead to a clear next step, it adds friction rather than value.

    The question is no longer, “Is the dashboard accurate?”
    It’s, “Does this dashboard change what we do next?”


    The Semantic Foundation AI Depends On

    AI can only be as good as the business logic it understands. When metrics mean different things to different teams, AI outputs drift quickly from reality. This is why KPI alignment is no longer a reporting exercise—it’s a strategic one.

    Effective KPI strategy consulting ensures that metrics are defined consistently, understood universally, and aligned to business outcomes. This semantic foundation is what allows AI and humans to reason from the same facts. Without it, predictions may look impressive but lead to the wrong decisions.


    Visualization as the Audit Trail for AI

    AI systems are powerful, but they are still black boxes to most leaders. Visual analytics turns those black boxes into transparent systems. Modern interactive business dashboards show not just outcomes, but inputs, thresholds, trends, and logic.

    This visual verification layer acts as an instant audit trail. Leaders can see how a recommendation was generated, assess risk, and decide whether to act. In regulated and high-stakes environments, this explainability is non-negotiable.

    Visualization is no longer about presentation. It’s about accountability.


    The Evolution of Power BI and Tableau

    The future of analytics is not a tool war. Power BI and Tableau are evolving toward the same destination: decision intelligence. Through Power BI dashboard development, organizations integrate real-time data, AI insights, and governed metrics into a unified environment. Tableau adds strength in deep exploration and explanation, especially where understanding drivers matters most.

    Together, these platforms support analytics that move at the speed of AI while remaining grounded in human judgment.


    Insights Where Work Happens

    One of the biggest shifts in analytics is location. Leaders don’t want another portal to check. They want insights inside the tools where decisions happen—CRM systems, collaboration platforms, and operational workflows. Power BI embedded analytics enables this shift by bringing verified insight directly into context.

    Dashboards are no longer places you go. They are systems that come to you.


    Performance Is a Trust Issue

    In the agentic era, slow dashboards don’t just frustrate users—they undermine confidence. Poor Power BI DirectQuery performance signals instability and causes leaders to question the data itself. Real-time expectations demand scalable models, predictable performance, and responsive interaction.

    If analytics can’t keep up, users fall back to spreadsheets, and the BI investment loses credibility.


    Governance Still Matters

    Autonomy without control is risk. As organizations scale analytics access, Power BI row level security and strong governance frameworks ensure that the right people see the right data at the right time. Trust isn’t just about accuracy—it’s about controlled visibility.

    This governance layer allows organizations to move fast without losing compliance or oversight.


    Designing for Leaders, Not Analysts

    Analysts explore data. Leaders make decisions. Executive leadership dashboards are built for speed, clarity, and alignment. They prioritize signals over noise, trends over tables, and outcomes over metrics volume.

    When dashboards are designed for how leaders actually think, adoption follows naturally.


    Visual Analytics as Strategic Capability

    Tableau visual analytics plays a critical role in helping leaders understand why outcomes change. In AI-driven environments, explanation becomes as valuable as prediction. Visualization bridges that gap by translating complexity into clarity.


    The Power of Narrative

    Insight alone doesn’t drive action. Alignment does. Data storytelling services turn analytics into narratives that teams can rally around. In the agentic era, storytelling is operational—it ensures that humans and machines move in the same direction.


    Designing Dashboards That Get Used

    Adoption is the ultimate success metric. Effective dashboard design consulting focuses on reducing cognitive load, aligning visuals to decisions, and embedding dashboards into real workflows. If users don’t return, the dashboard has failed—regardless of how accurate the data is.


    Strategy Before Tools

    Technology doesn’t deliver ROI on its own. Analytics strategy services align BI initiatives with business priorities, maturity, and change readiness. This strategic layer ensures analytics investments translate into measurable outcomes.


    Making BI Habitual

    Even the best dashboards fail without adoption. BI adoption services address training, enablement, and cultural change, ensuring analytics becomes part of daily decision-making rather than an optional resource.


    Measuring What Matters

    Successful dashboards focus on outcomes, not activity. KPI dashboard services help organizations track the metrics that directly influence performance, risk, and growth.


    Why VisualizExpert Exists

    At VisualizExpert, our VisualizExpert dashboards reviews evaluate analytics through one lens: decision impact. We assess clarity, alignment, performance, and adoption to ensure dashboards earn their place in leadership workflows.


    BI and AI Are Stronger Together

    The future isn’t BI versus AI. It’s BI with AI. Analytics transformation consulting brings prediction, semantics, visualization, and governance together into a single decision stack.

    Dashboards aren’t obsolete. The relationship to them is evolving. They are becoming the real-time interface between human judgment and autonomous systems—the layer where decisions are understood, validated, and aligned.

    In the agentic era, that makes dashboards more important than ever.

    If your dashboards aren’t driving decisions, it’s time to rethink how they’re designed. Explore how VisualizExpert helps organizations build decision-ready analytics.